29
/
en
AIzaSyAYiBZKx7MnpbEhh9jyipgxe19OcubqV5w
April 1, 2024
240393
Singapore
SGP
true
2
1
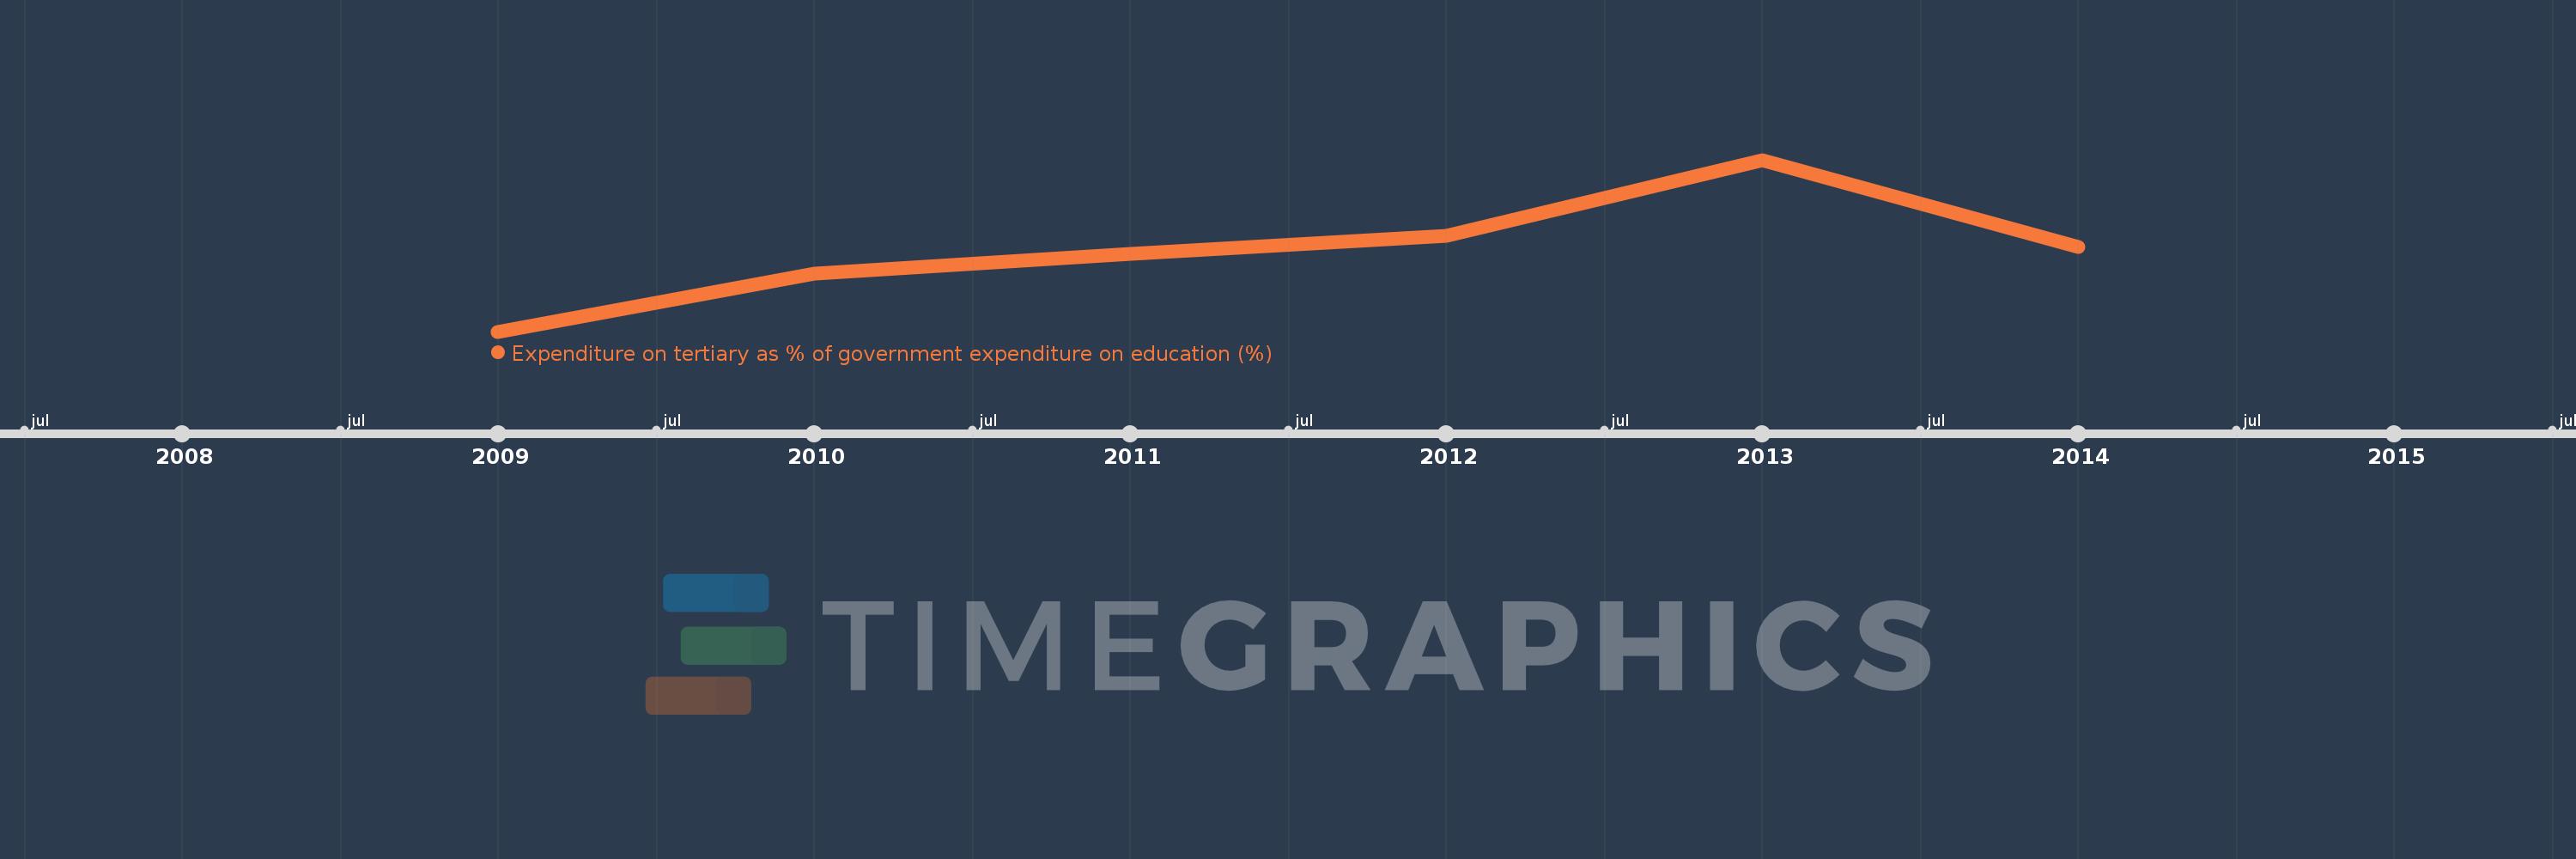
Expenditure on tertiary as % of government expenditure on education (%)
2014,2013,2012,2011,2010,2009
This statistics in other country:
Timeline:
This timeline shows a graph from 2009 to 2014 of Singapore. No data until 2008. Number of actual observations by date: 6.
Source name:
World Development Indicators
Source organization:
UNESCO Institute for Statistics
Categories, topics:
Education
Last updated:
apr 23, 2017
Indicators value changes by year
Minimum:
32.591
jan 1, 2009
Maximum:
38.035
jan 1, 2013
At the date of observation
Value
Absolute change
Change from previous value
jan 1, 2009
32.591
+32.591
0.0%
jan 1, 2010
34.417
+1.826
5.6%
jan 1, 2011
35.062
+0.645
1.87%
jan 1, 2012
35.631
+0.569
1.62%
jan 1, 2013
38.035
+2.405
6.75%
jan 1, 2014
35.284
-2.751
-7.23%
Ranking of countries by current statistics by years


Comments: