29
/
en
AIzaSyAYiBZKx7MnpbEhh9jyipgxe19OcubqV5w
April 1, 2024
93484
Bulgaria
BGR
true
2
1
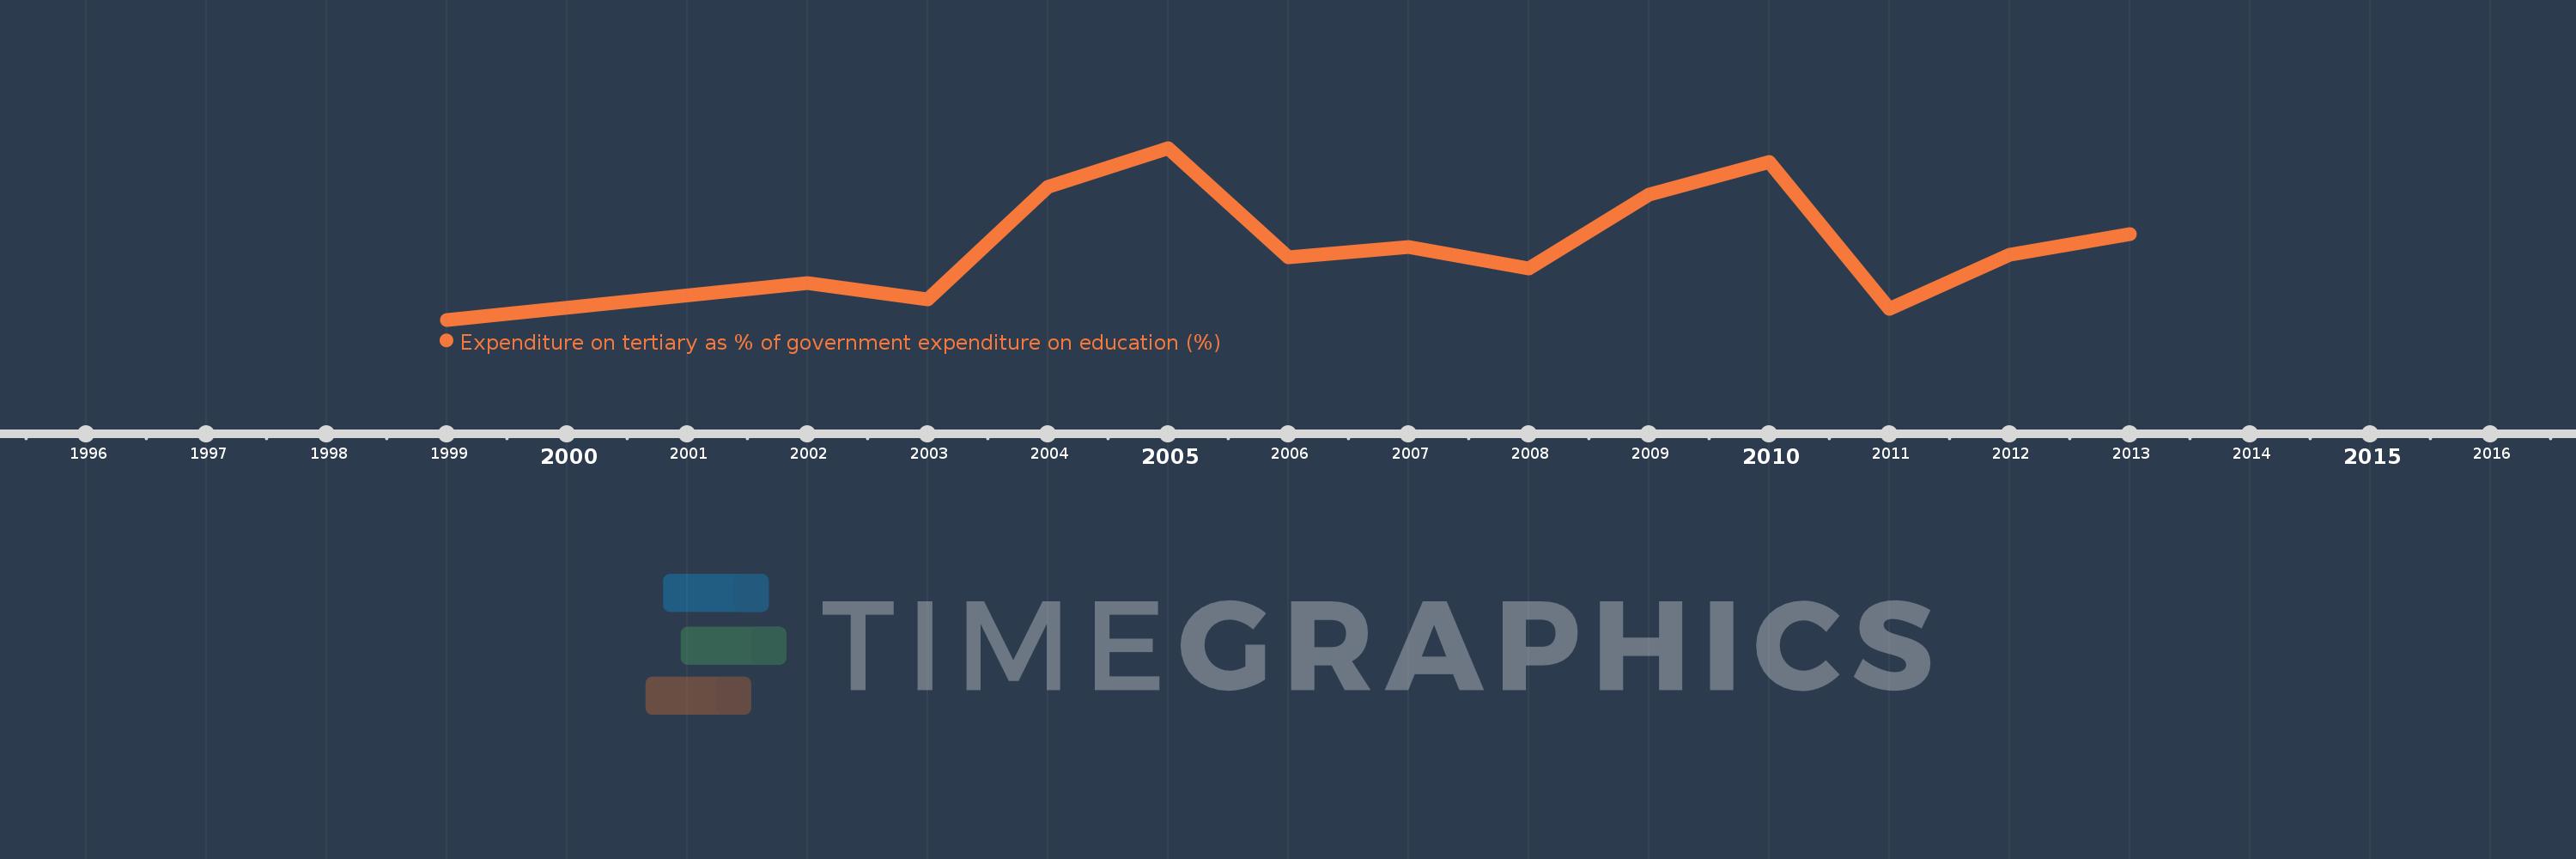
Expenditure on tertiary as % of government expenditure on education (%)
2013,2012,2011,2010,2009,2008,2007,2006,2005,2004,2003,2002,1999
This statistics in other country:
Timeline:
This timeline shows a graph from 1999 to 2013 of Bulgaria. No data until 1998. Number of actual observations by date: 13.
Source name:
World Development Indicators
Source organization:
UNESCO Institute for Statistics
Categories, topics:
Education
Last updated:
apr 23, 2017
Indicators value changes by year
Maximum:
21.273
jan 1, 2005
At the date of observation
Value
Absolute change
Change from previous value
jan 1, 1999
14.36
+14.36
0.0%
jan 1, 2002
15.85
+1.49
10.37%
jan 1, 2003
15.195
-0.655
-4.13%
jan 1, 2004
19.696
+4.502
29.63%
jan 1, 2005
21.273
+1.577
8.0%
jan 1, 2006
16.86
-4.413
-20.75%
jan 1, 2007
17.289
+0.429
2.54%
jan 1, 2008
16.432
-0.857
-4.96%
jan 1, 2009
19.4
+2.968
18.06%
jan 1, 2010
20.694
+1.294
6.67%
jan 1, 2011
14.808
-5.887
-28.45%
jan 1, 2012
16.976
+2.168
14.64%
jan 1, 2013
17.806
+0.829
4.89%
Ranking of countries by current statistics by years


Comments: