29
/
en
AIzaSyAYiBZKx7MnpbEhh9jyipgxe19OcubqV5w
April 1, 2024
207877
Netherlands
NLD
true
2
1
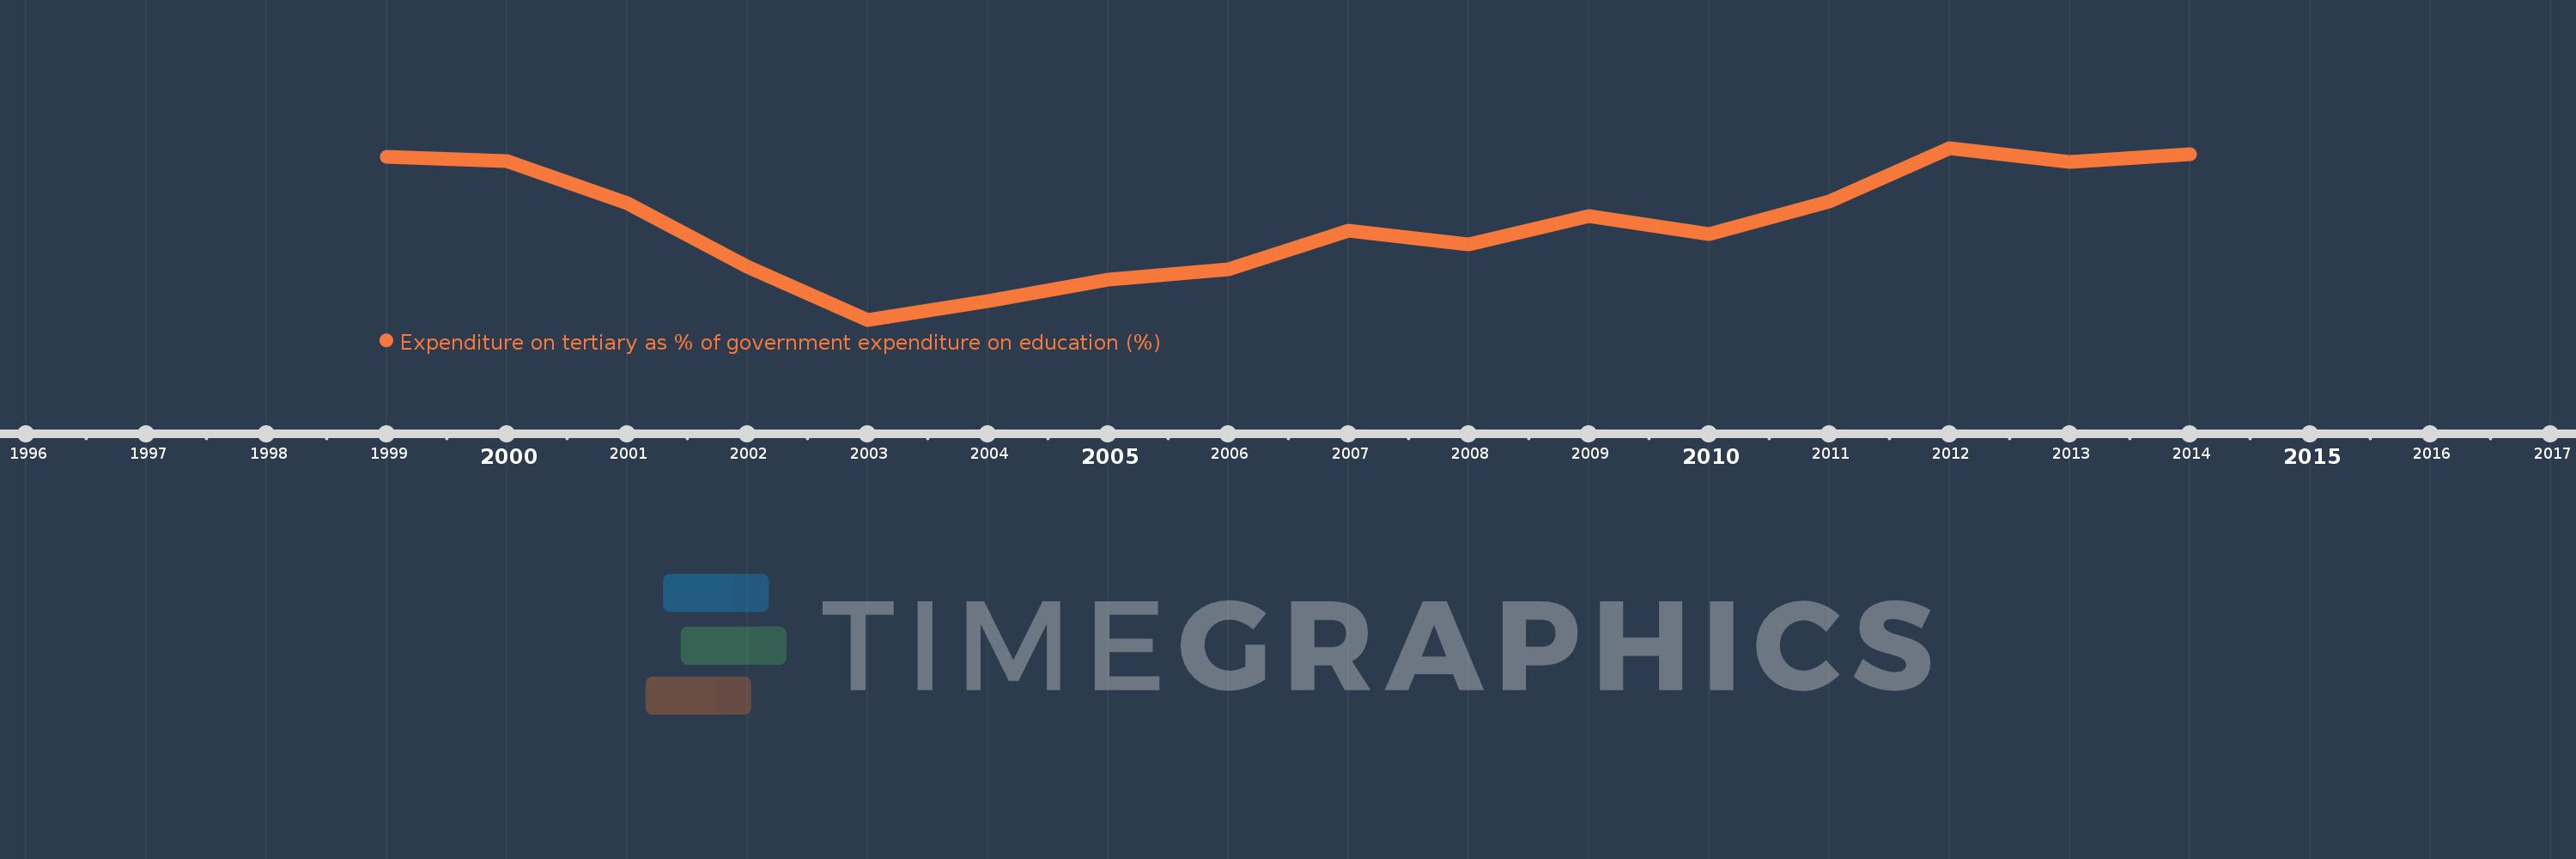
Expenditure on tertiary as % of government expenditure on education (%)
2014,2013,2012,2011,2010,2009,2008,2007,2006,2005,2004,2003,2002,2001,2000,1999
This statistics in other country:
Timeline:
This timeline shows a graph from 1999 to 2014 of Netherlands. No data until 1998. Number of actual observations by date: 16.
Source name:
World Development Indicators
Source organization:
UNESCO Institute for Statistics
Categories, topics:
Education
Last updated:
apr 23, 2017
Indicators value changes by year
Minimum:
25.832
jan 1, 2003
Maximum:
29.056
jan 1, 2012
At the date of observation
Value
Absolute change
Change from previous value
jan 1, 1999
28.892
+28.892
0.0%
jan 1, 2000
28.803
-0.09
-0.31%
jan 1, 2001
28.017
-0.785
-2.73%
jan 1, 2002
26.829
-1.188
-4.24%
jan 1, 2003
25.832
-0.997
-3.71%
jan 1, 2004
26.185
+0.353
1.37%
jan 1, 2005
26.59
+0.405
1.55%
jan 1, 2006
26.774
+0.184
0.69%
jan 1, 2007
27.507
+0.733
2.74%
jan 1, 2008
27.246
-0.261
-0.95%
jan 1, 2009
27.775
+0.529
1.94%
jan 1, 2010
27.434
-0.34
-1.23%
jan 1, 2011
28.049
+0.614
2.24%
jan 1, 2012
29.056
+1.007
3.59%
jan 1, 2013
28.787
-0.268
-0.92%
jan 1, 2014
28.94
+0.152
0.53%
Ranking of countries by current statistics by years


Comments: