29
/
en
AIzaSyAYiBZKx7MnpbEhh9jyipgxe19OcubqV5w
April 1, 2024
99842
Cameroon
CMR
true
2
1
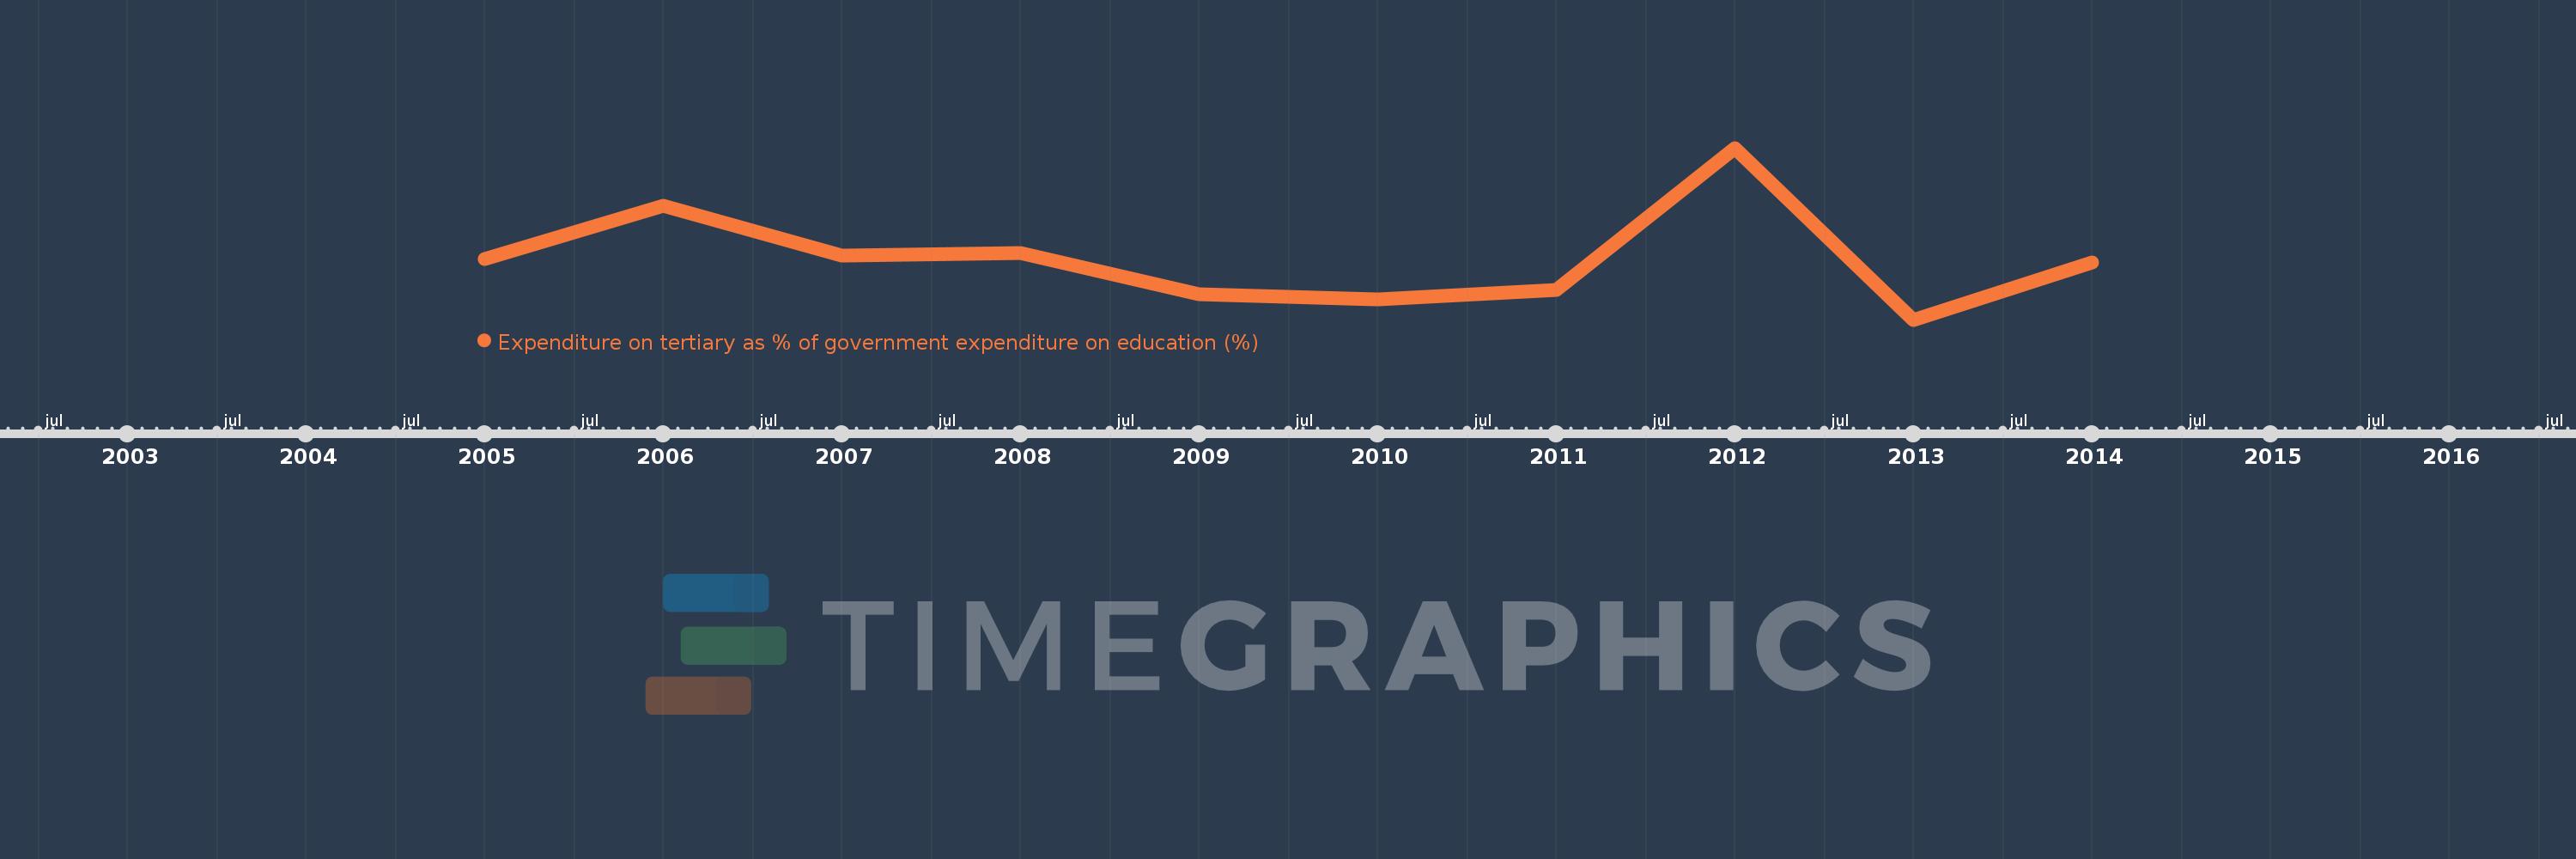
Expenditure on tertiary as % of government expenditure on education (%)
2014,2013,2012,2011,2010,2009,2008,2007,2006,2005
This statistics in other country:
Timeline:
This timeline shows a graph from 2005 to 2014 of Cameroon. No data until 2004. Number of actual observations by date: 10.
Source name:
World Development Indicators
Source organization:
UNESCO Institute for Statistics
Categories, topics:
Education
Last updated:
apr 23, 2017
Indicators value changes by year
Maximum:
15.094
jan 1, 2012
At the date of observation
Value
Absolute change
Change from previous value
jan 1, 2005
10.362
+10.362
0.0%
jan 1, 2006
12.643
+2.281
22.01%
jan 1, 2007
10.498
-2.145
-16.97%
jan 1, 2008
10.615
+0.117
1.11%
jan 1, 2009
8.851
-1.764
-16.61%
jan 1, 2010
8.626
-0.226
-2.55%
jan 1, 2011
9.043
+0.417
4.83%
jan 1, 2012
15.094
+6.051
66.91%
jan 1, 2013
7.77
-7.324
-48.52%
jan 1, 2014
10.207
+2.437
31.37%
Ranking of countries by current statistics by years


Comments: