29
/
en
AIzaSyAYiBZKx7MnpbEhh9jyipgxe19OcubqV5w
April 1, 2024
123416
Ecuador
ECU
true
2
1
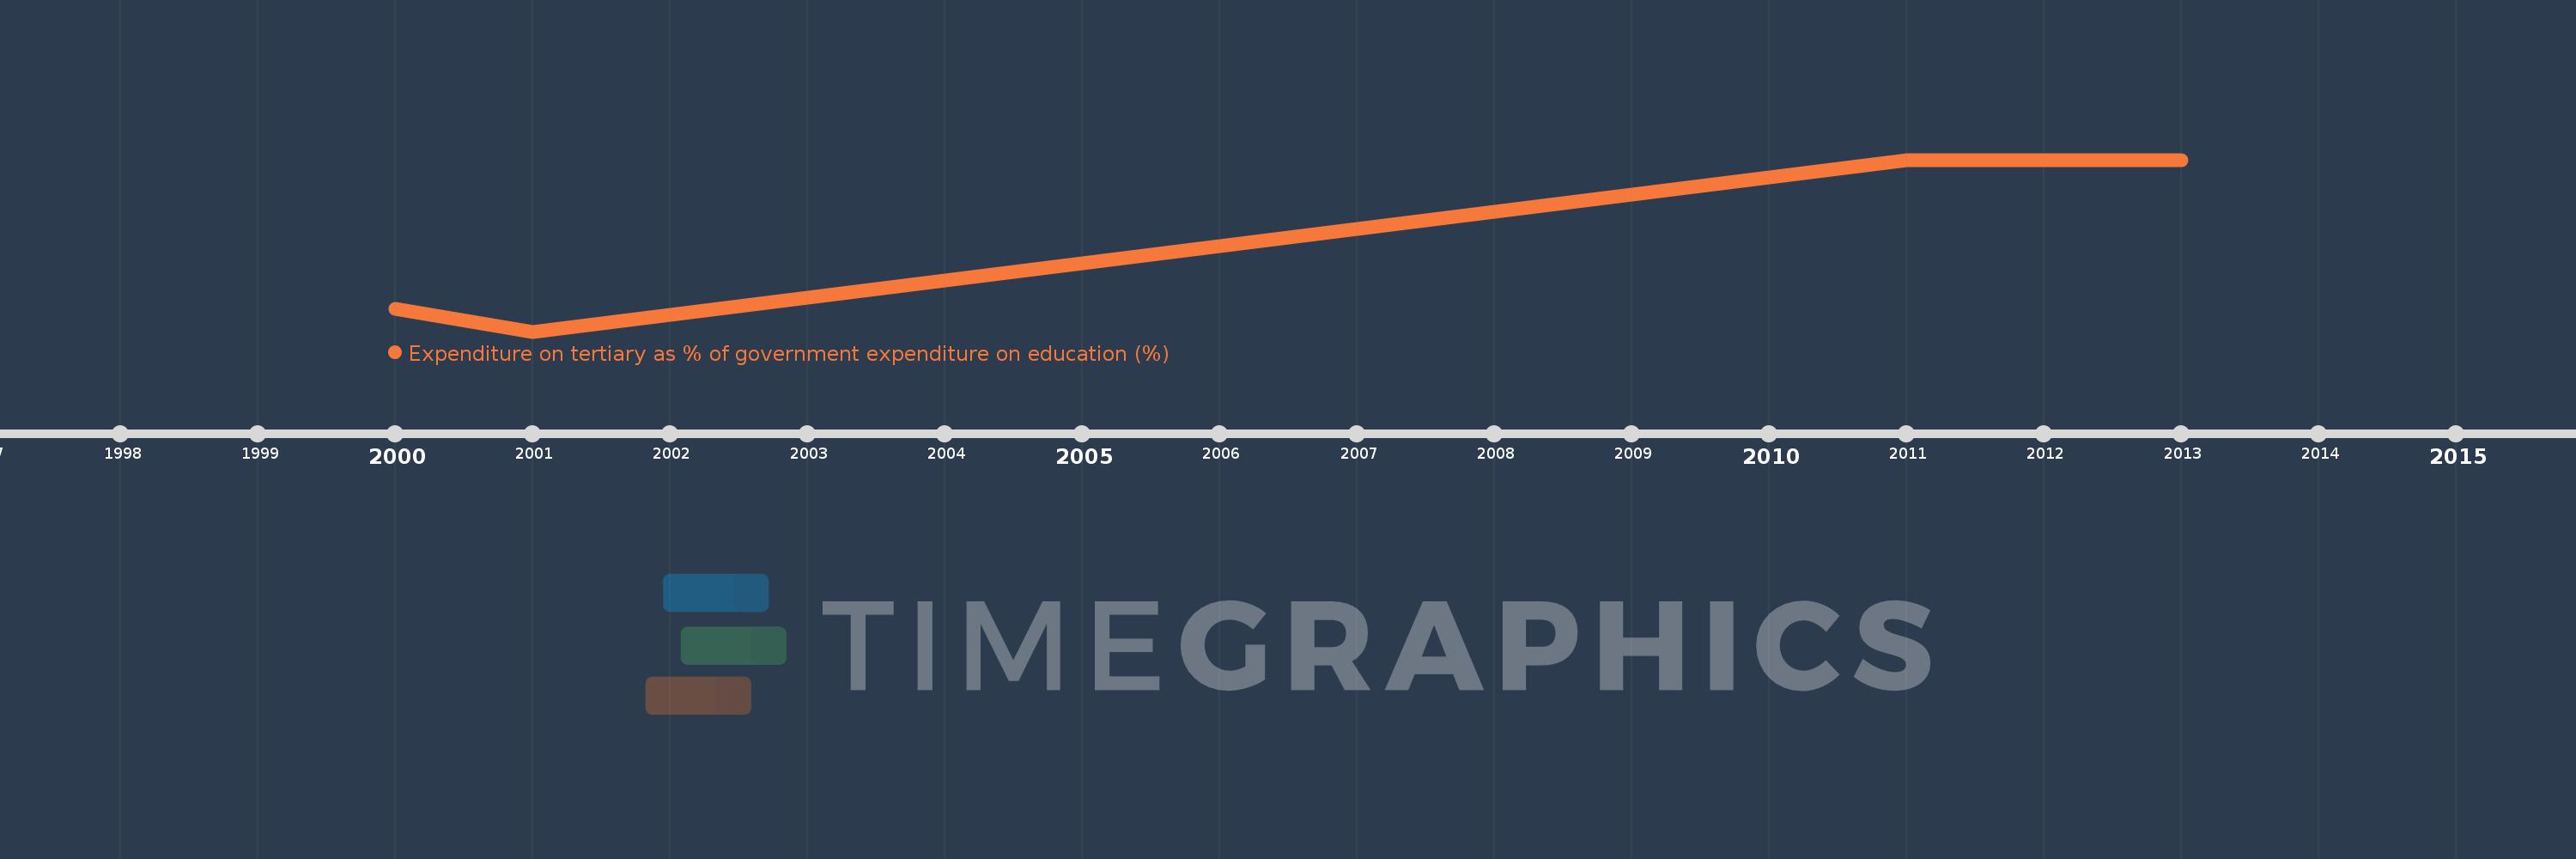
Expenditure on tertiary as % of government expenditure on education (%)
2013,2012,2011,2001,2000
This statistics in other country:
Timeline:
This timeline shows a graph from 2000 to 2013 of Ecuador. No data until 1999. Number of actual observations by date: 5.
Source name:
World Development Indicators
Source organization:
UNESCO Institute for Statistics
Categories, topics:
Education
Last updated:
apr 23, 2017
Indicators value changes by year
Maximum:
26.661
jan 1, 2013
At the date of observation
Value
Absolute change
Change from previous value
jan 1, 2000
8.005
+8.005
0.0%
jan 1, 2001
5.16
-2.845
-35.54%
jan 1, 2011
26.576
+21.416
415.03%
jan 1, 2012
26.585
+0.009
0.03%
jan 1, 2013
26.661
+0.076
0.29%
Ranking of countries by current statistics by years


Comments: