29
/
en
AIzaSyAYiBZKx7MnpbEhh9jyipgxe19OcubqV5w
April 1, 2024
72912
Australia
AUS
true
2
1
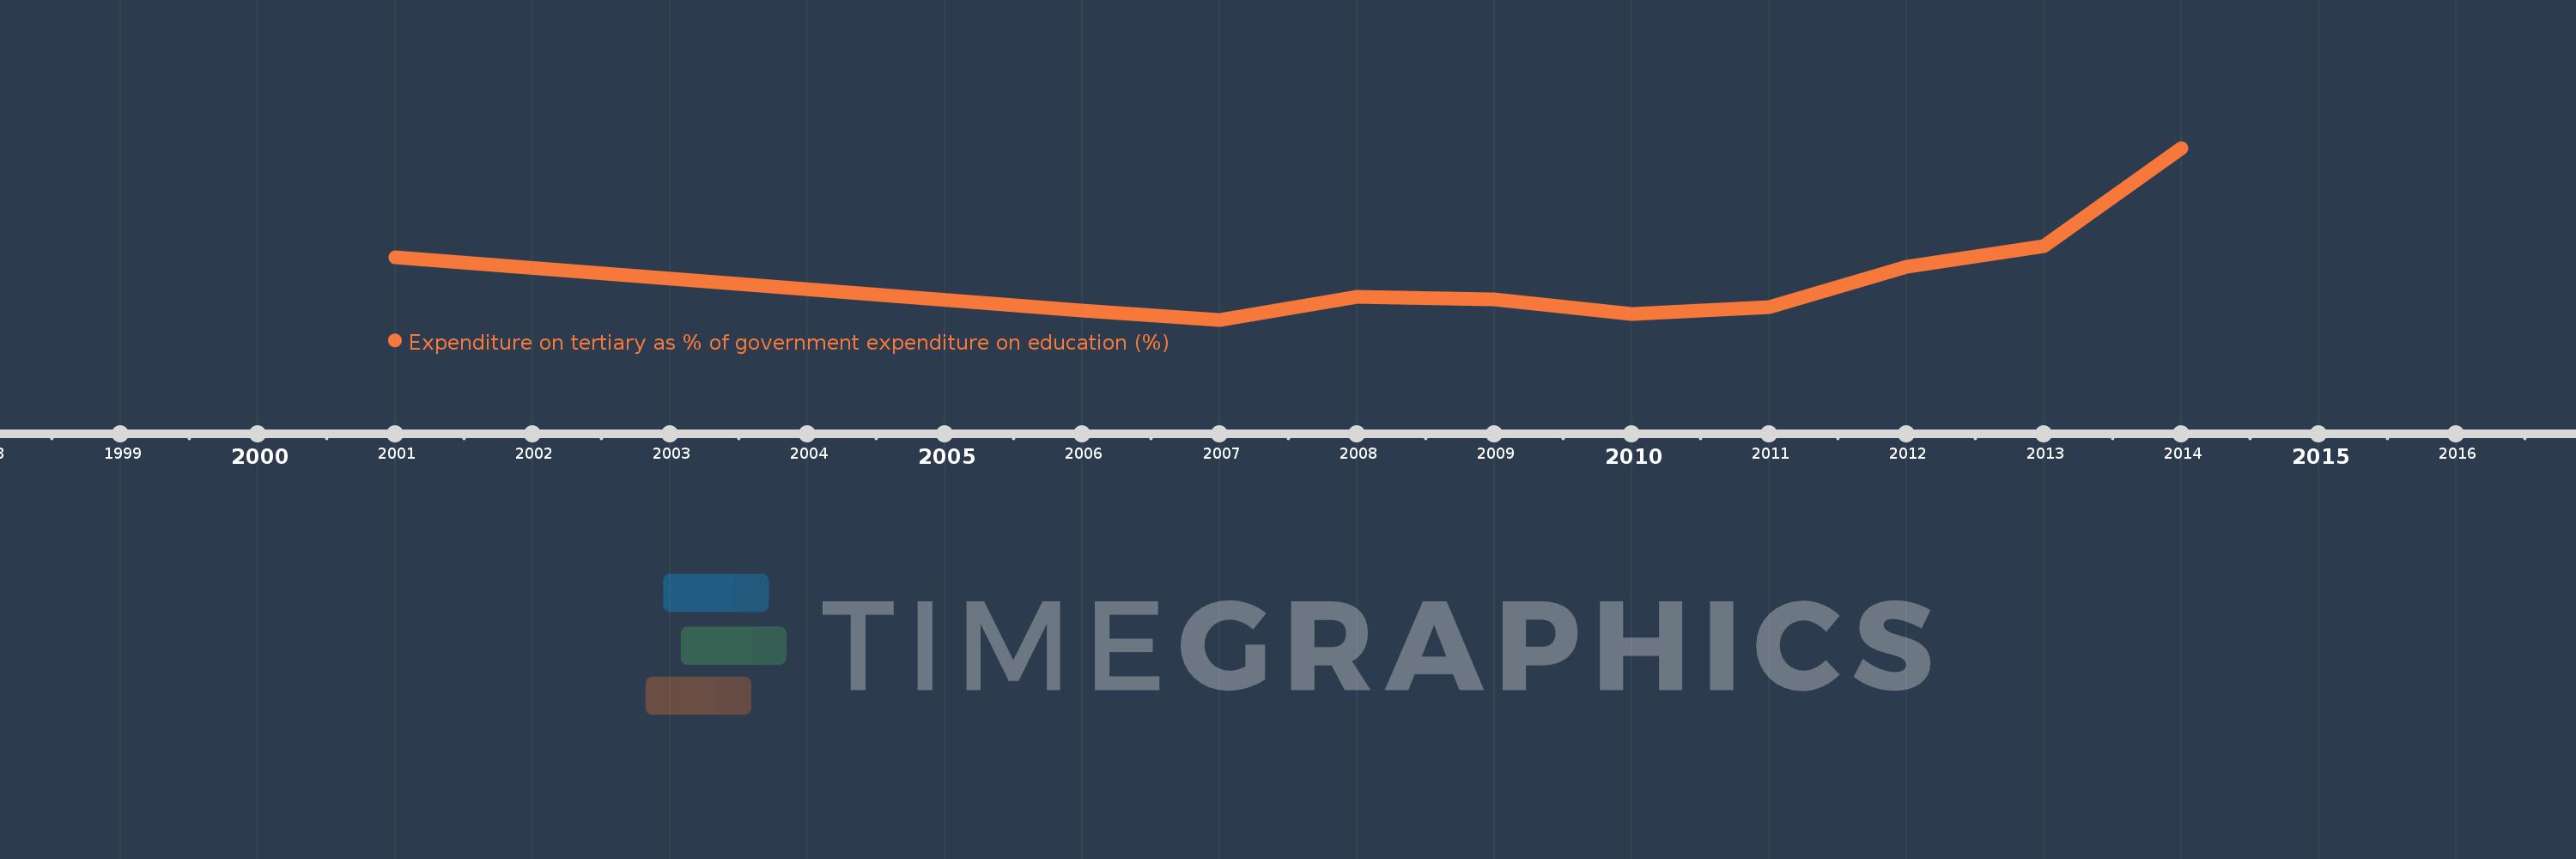
Expenditure on tertiary as % of government expenditure on education (%)
2014,2013,2012,2011,2010,2009,2008,2007,2006,2001
This statistics in other country:
Timeline:
This timeline shows a graph from 2001 to 2014 of Australia. No data until 2000. Number of actual observations by date: 10.
Source name:
World Development Indicators
Source organization:
UNESCO Institute for Statistics
Categories, topics:
Education
Last updated:
apr 23, 2017
Indicators value changes by year
Maximum:
25.948
jan 1, 2014
At the date of observation
Value
Absolute change
Change from previous value
jan 1, 2001
23.42
+23.42
0.0%
jan 1, 2006
22.195
-1.225
-5.23%
jan 1, 2007
21.98
-0.215
-0.97%
jan 1, 2008
22.502
+0.522
2.37%
jan 1, 2009
22.459
-0.043
-0.19%
jan 1, 2010
22.113
-0.346
-1.54%
jan 1, 2011
22.277
+0.164
0.74%
jan 1, 2012
23.202
+0.925
4.15%
jan 1, 2013
23.679
+0.477
2.05%
jan 1, 2014
25.948
+2.27
9.59%
Ranking of countries by current statistics by years


Comments: