29
/
en
AIzaSyAYiBZKx7MnpbEhh9jyipgxe19OcubqV5w
April 1, 2024
209257
New Zealand
NZL
true
2
1
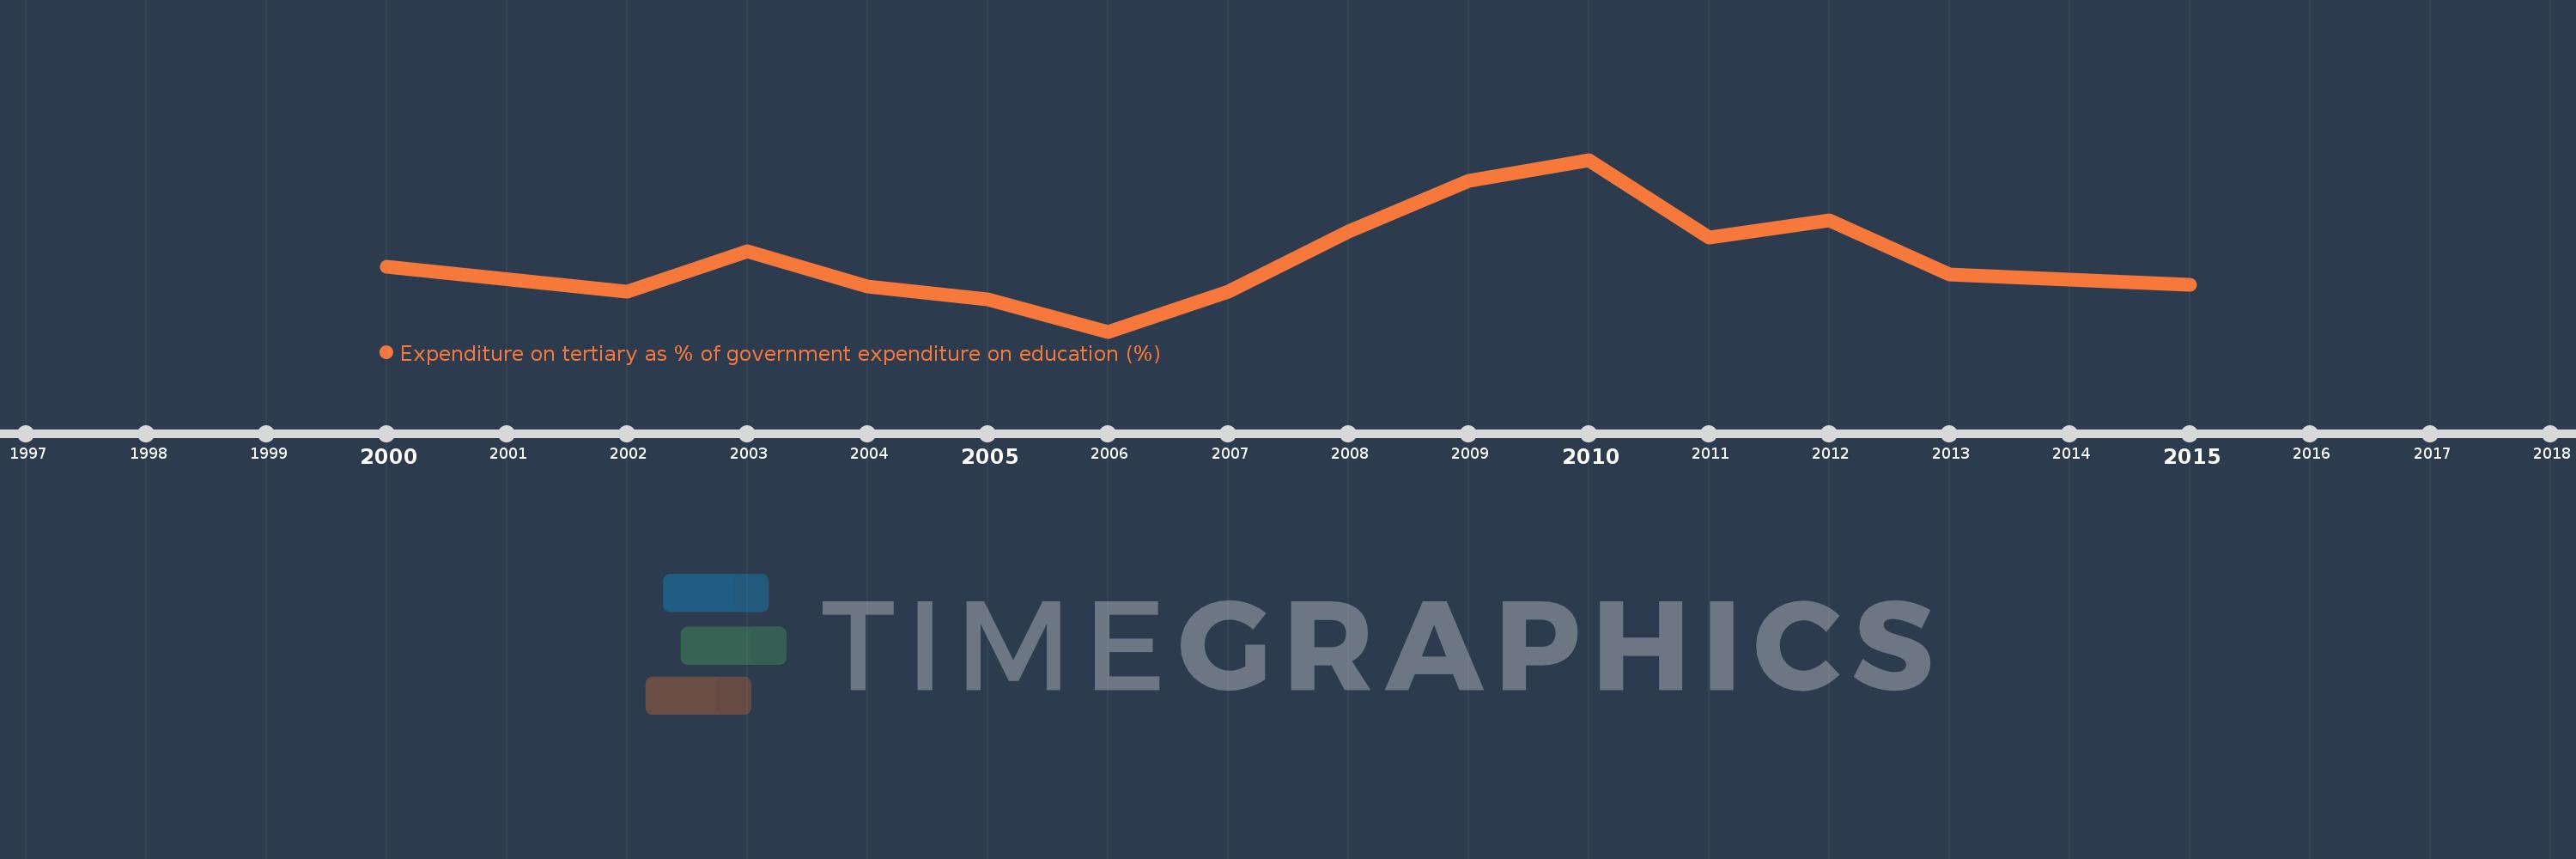
Expenditure on tertiary as % of government expenditure on education (%)
2015,2013,2012,2011,2010,2009,2008,2007,2006,2005,2004,2003,2002,2000
This statistics in other country:
Timeline:
This timeline shows a graph from 2000 to 2015 of New Zealand. No data until 1999. Number of actual observations by date: 14.
Source name:
World Development Indicators
Source organization:
UNESCO Institute for Statistics
Categories, topics:
Education
Last updated:
apr 23, 2017
Indicators value changes by year
Minimum:
23.143
jan 1, 2006
Maximum:
29.727
jan 1, 2010
At the date of observation
Value
Absolute change
Change from previous value
jan 1, 2000
25.638
+25.638
0.0%
jan 1, 2002
24.667
-0.97
-3.78%
jan 1, 2003
26.213
+1.546
6.27%
jan 1, 2004
24.867
-1.346
-5.13%
jan 1, 2005
24.374
-0.493
-1.98%
jan 1, 2006
23.143
-1.231
-5.05%
jan 1, 2007
24.676
+1.533
6.63%
jan 1, 2008
26.986
+2.309
9.36%
jan 1, 2009
28.918
+1.932
7.16%
jan 1, 2010
29.727
+0.809
2.8%
jan 1, 2011
26.758
-2.97
-9.99%
jan 1, 2012
27.408
+0.65
2.43%
jan 1, 2013
25.329
-2.079
-7.59%
jan 1, 2015
24.949
-0.38
-1.5%
Ranking of countries by current statistics by years


Comments: