29
/
en
AIzaSyAYiBZKx7MnpbEhh9jyipgxe19OcubqV5w
April 1, 2024
197468
Moldova
MDA
true
2
1
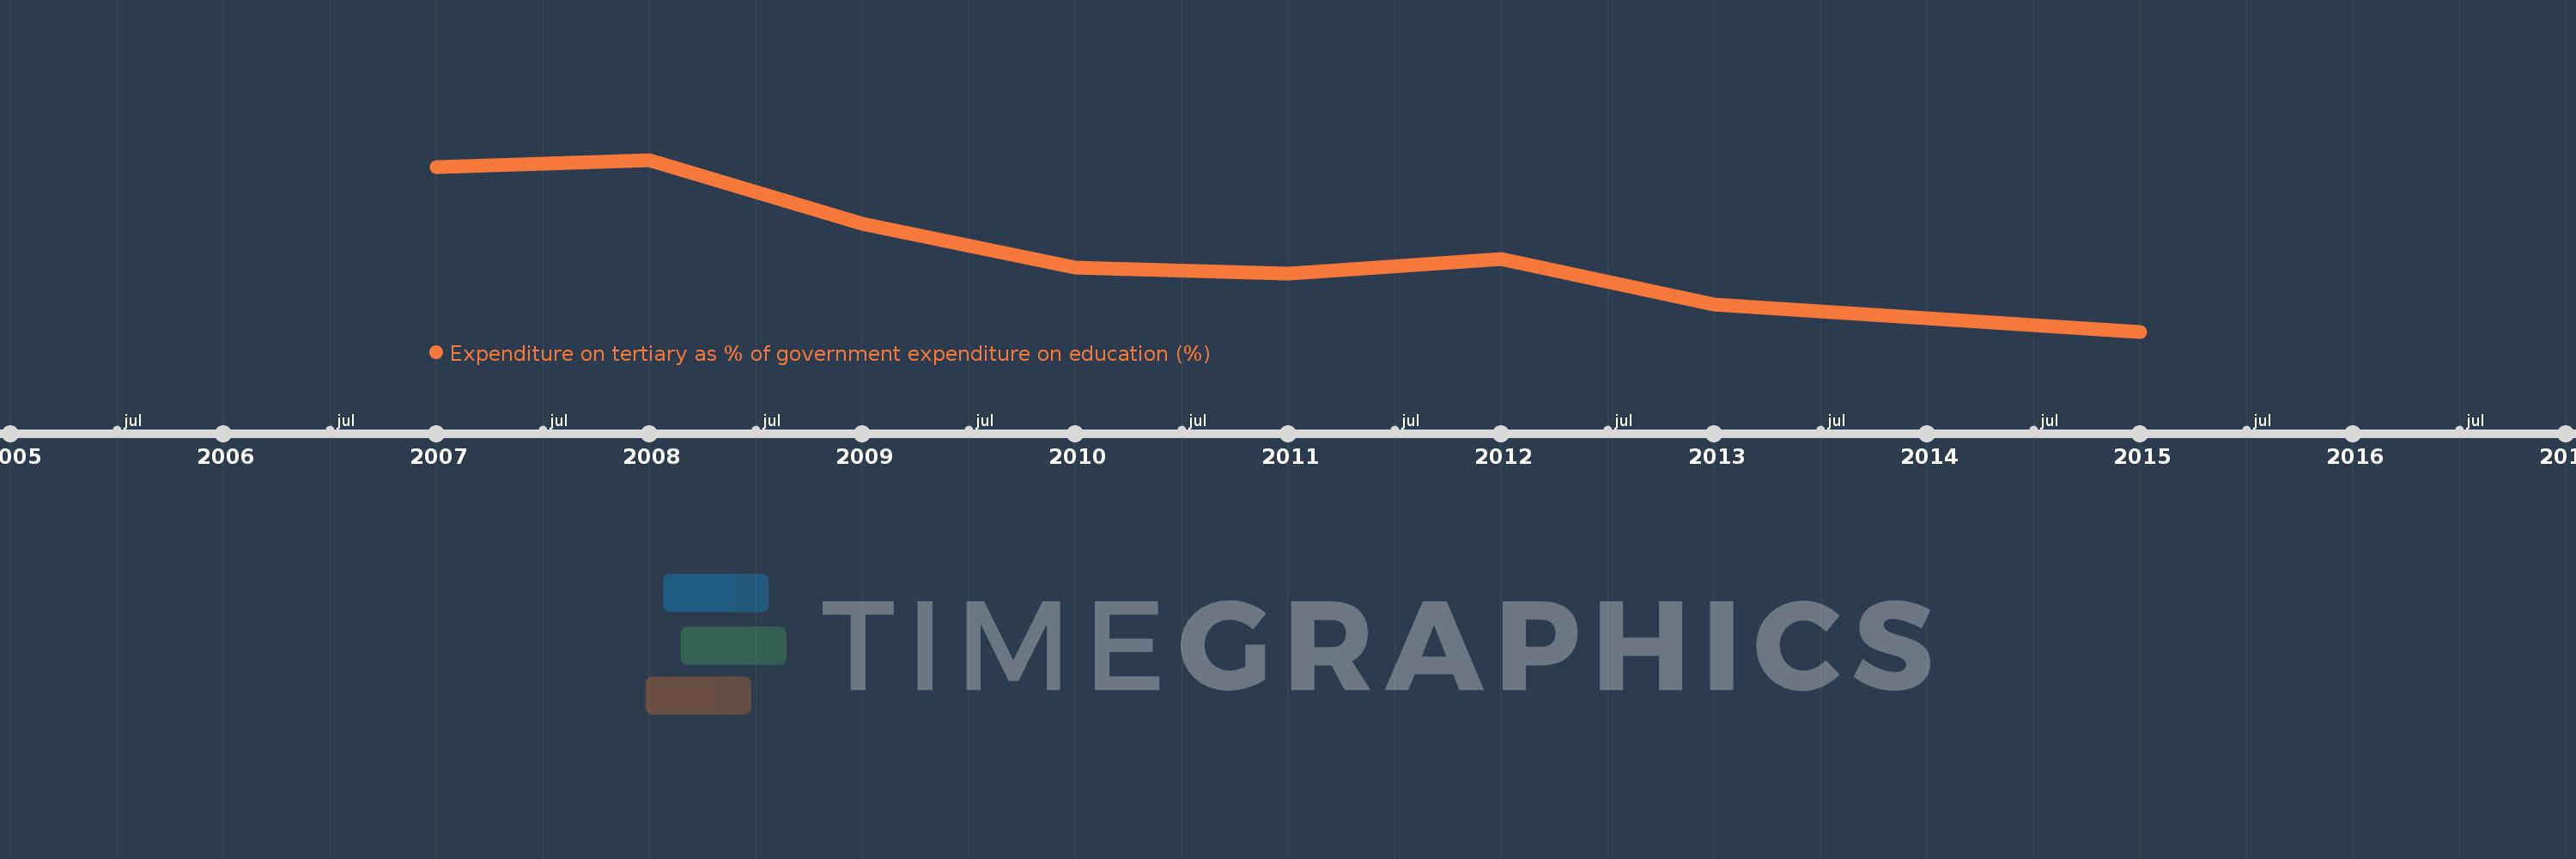
Expenditure on tertiary as % of government expenditure on education (%)
2015,2013,2012,2011,2010,2009,2008,2007
This statistics in other country:
Timeline:
This timeline shows a graph from 2007 to 2015 of Moldova. No data until 2006. Number of actual observations by date: 8.
Source name:
World Development Indicators
Source organization:
UNESCO Institute for Statistics
Categories, topics:
Education
Last updated:
apr 23, 2017
Indicators value changes by year
Minimum:
17.195
jan 1, 2015
At the date of observation
Value
Absolute change
Change from previous value
jan 1, 2007
19.415
+19.415
0.0%
jan 1, 2008
19.51
+0.095
0.49%
jan 1, 2009
18.645
-0.865
-4.43%
jan 1, 2010
18.059
-0.587
-3.15%
jan 1, 2011
17.976
-0.082
-0.46%
jan 1, 2012
18.174
+0.198
1.1%
jan 1, 2013
17.563
-0.611
-3.36%
jan 1, 2015
17.195
-0.368
-2.1%
Ranking of countries by current statistics by years


Comments: