29
/
en
AIzaSyAYiBZKx7MnpbEhh9jyipgxe19OcubqV5w
April 1, 2024
251827
St. Vincent and the Grenadines
VCT
true
2
1
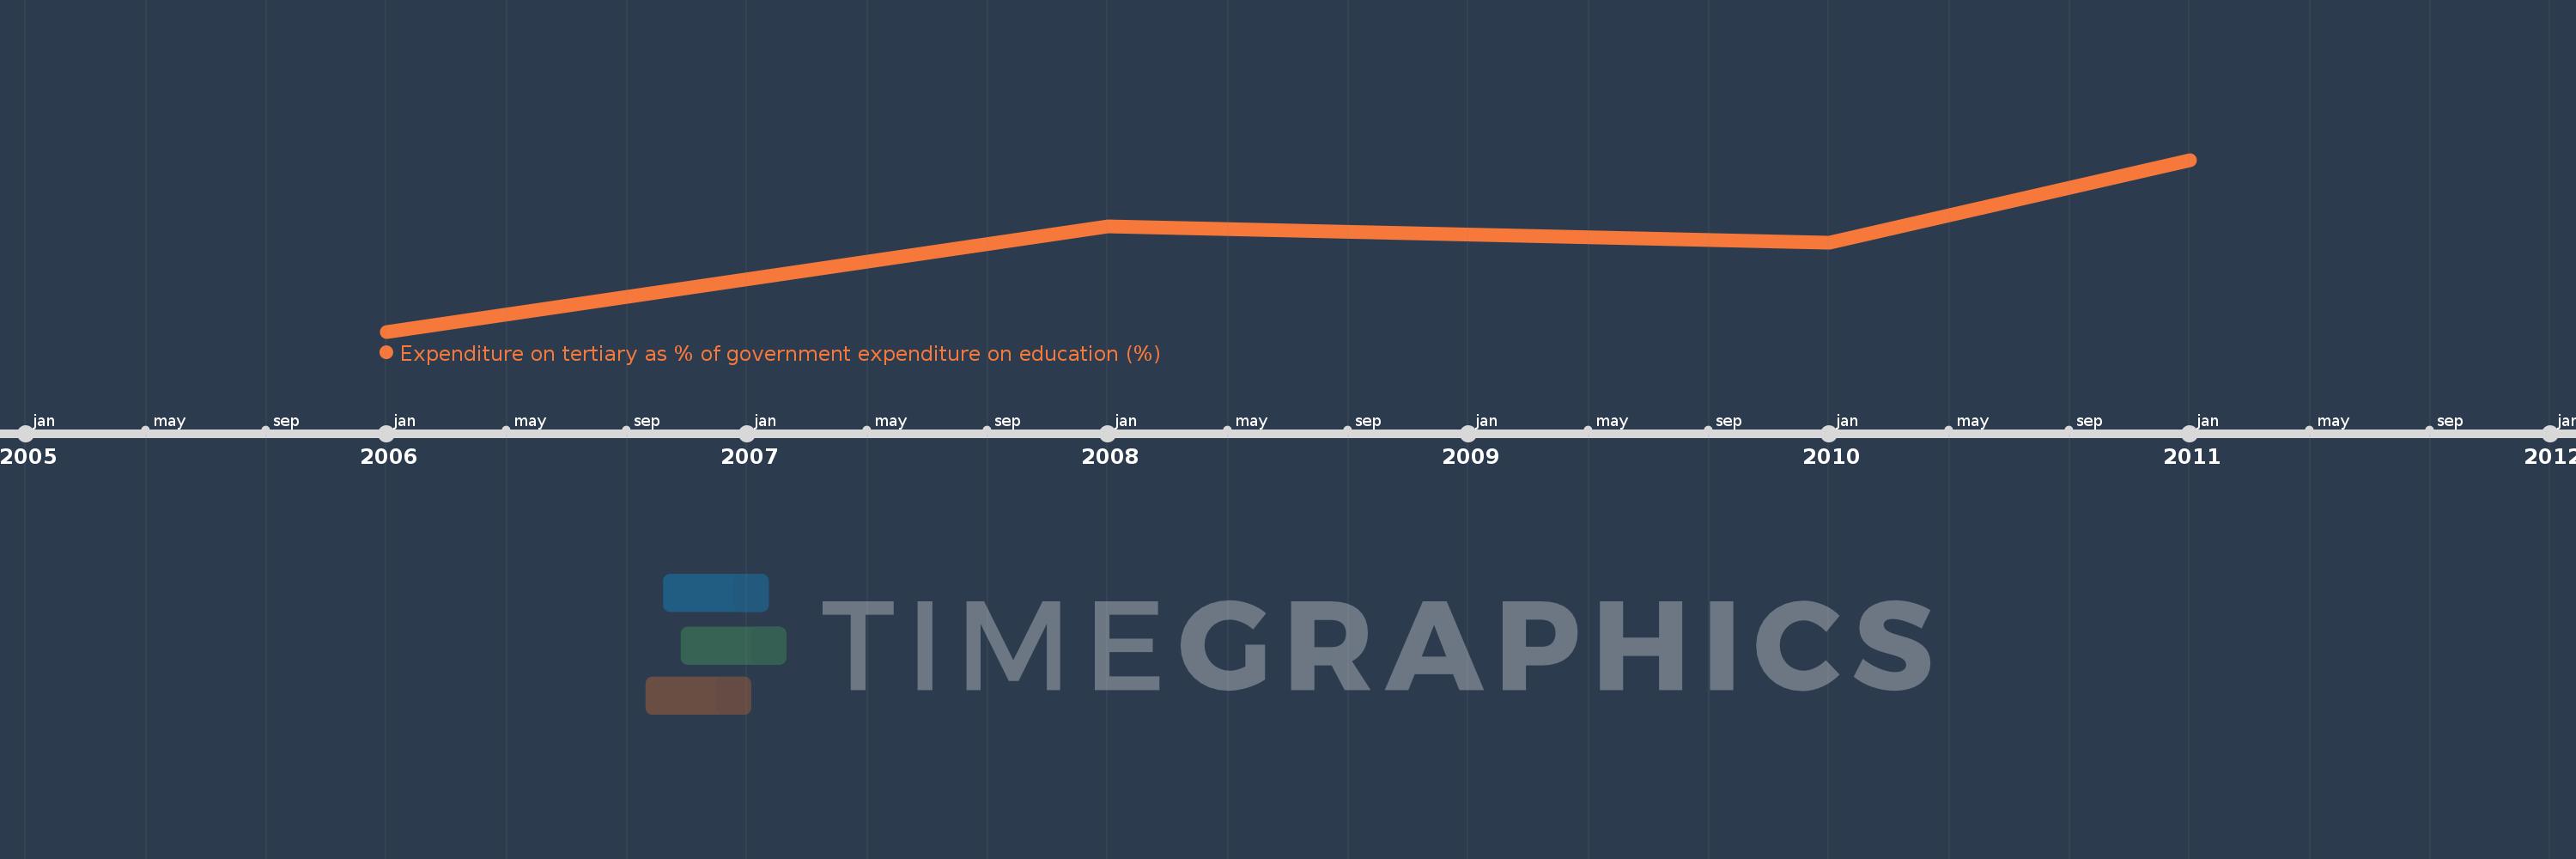
Expenditure on tertiary as % of government expenditure on education (%)
2011,2010,2008,2006
This statistics in other country:
Timeline:
This timeline shows a graph from 2006 to 2011 of St. Vincent and the Grenadines. No data until 2005. Number of actual observations by date: 4.
Source name:
World Development Indicators
Source organization:
UNESCO Institute for Statistics
Categories, topics:
Education
Last updated:
apr 23, 2017
Indicators value changes by year
At the date of observation
Value
Absolute change
Change from previous value
jan 1, 2006
3.706
+3.706
0.0%
jan 1, 2008
5.73
+2.024
54.6%
jan 1, 2010
5.415
-0.314
-5.49%
jan 1, 2011
7.01
+1.595
29.45%
Ranking of countries by current statistics by years


Comments: