29
/de/
de
AIzaSyAYiBZKx7MnpbEhh9jyipgxe19OcubqV5w
April 1, 2024
206672
Nepal
NPL
true
2
1
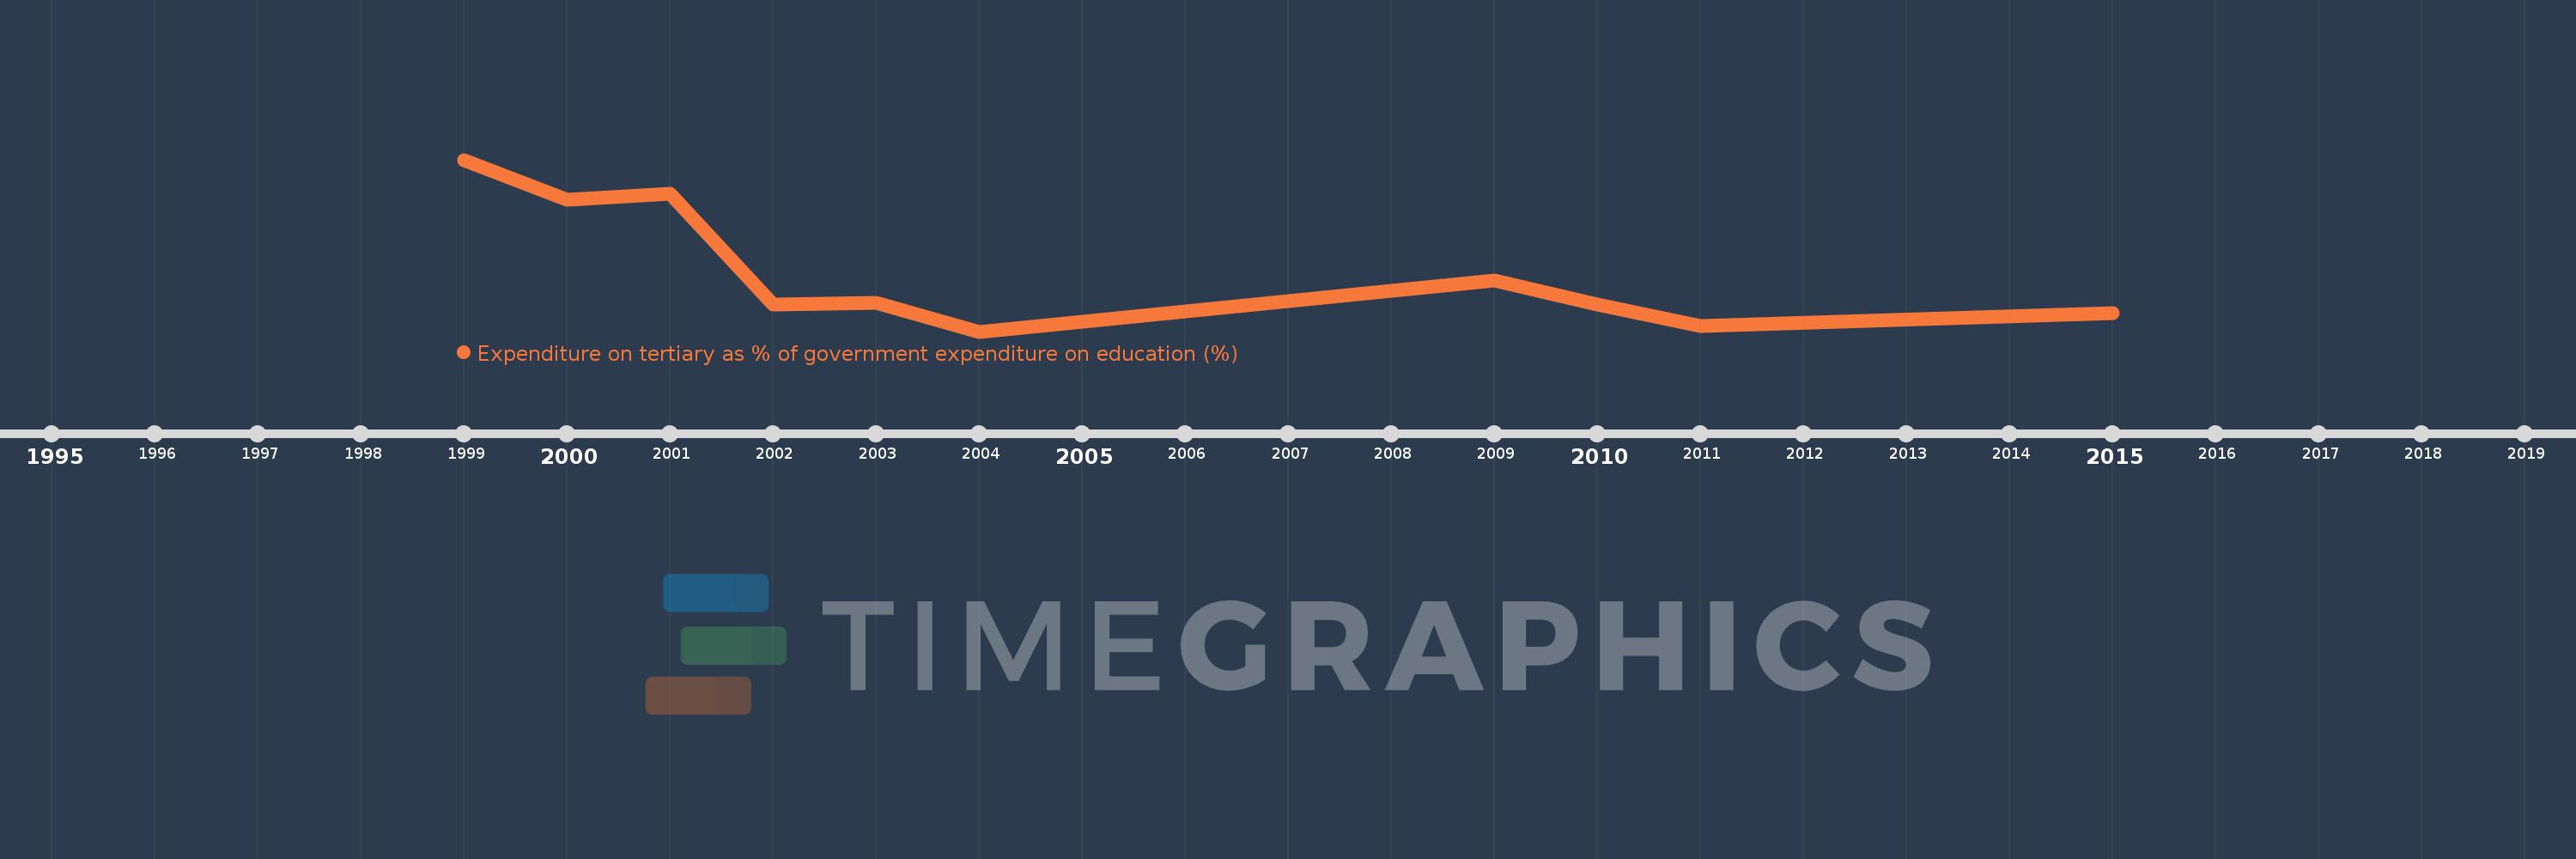
Expenditure on tertiary as % of government expenditure on education (%)
2015,2011,2010,2009,2004,2003,2002,2001,2000,1999
Diese Statistik in anderen Ländern:
Zeitlinie:
Diese Zeitleiste vorliegt die Graphik ab 1999 J. bis 2015 J. Nepal. Die Angaben bis 1998 J. sind nicht vorhanden. Die Zahl aktueller Beobachtungen nach Daten: 10.
Die Quelle (Bezeichnung):
Kennzahlen der Weltentwicklung
Die Quelle (Einrichtung):
UNESCO Institute for Statistics
Kategorien:
Education
Es wurde aktualisiert:
23 Apr 2017 Jahr
Kennzahlen der Wertänderungen vom Jahr zum Jahr
Minimum:
10.281
1 Jan 2004 Jahr
Maximum:
20.955
1 Jan 1999 Jahr
Zum Datum der Beobachtung
Wert
Absolute Veränderung
Die Veränderung bezüglich dem vorherigen Wert
1 Jan 1999 Jahr
20.955
+20.955
0.0%
1 Jan 2000 Jahr
18.45
-2.506
-11.96%
1 Jan 2001 Jahr
18.822
+0.373
2.02%
1 Jan 2002 Jahr
11.941
-6.882
-36.56%
1 Jan 2003 Jahr
12.072
+0.131
1.1%
1 Jan 2004 Jahr
10.281
-1.791
-14.83%
1 Jan 2009 Jahr
13.458
+3.176
30.9%
1 Jan 2010 Jahr
11.982
-1.475
-10.96%
1 Jan 2011 Jahr
10.653
-1.33
-11.1%
1 Jan 2015 Jahr
11.407
+0.755
7.08%
Bewertung der Länder gemäß mit laufender Statistik nach Jahren


Kommentare: