29
/
en
AIzaSyAYiBZKx7MnpbEhh9jyipgxe19OcubqV5w
April 1, 2024
98174
Cambodia
KHM
true
2
1
Adjusted savings: net national savings (current US$)
2015,2014,2013,2012,2011,2010,2009,2008,2007,2006,2005,2004,2003,2002,2001,2000,1999,1998,1997,1996
Download
Global statistics library →Cambodia →

Adjusted savings: net national savings (current US$)

This statistics in other country:
AfghanistanAlbaniaAlgeriaAngolaAntigua and BarbudaArgentinaArmeniaAustraliaAustriaAzerbaijanBahamas, TheBahrainBangladeshBarbadosBelarusBelgiumBelizeBeninBermudaBhutanBoliviaBosnia and HerzegovinaBotswanaBrazilBrunei DarussalamBulgariaBurkina FasoBurundiCabo VerdeCambodiaCameroonCanadaCentral African RepublicChadChileChinaColombiaComorosCongo, Dem. Rep.Congo, Rep.Costa RicaCote d'IvoireCroatiaCyprusCzech RepublicDenmarkDjiboutiDominicaDominican RepublicEcuadorEgypt, Arab Rep.El SalvadorEquatorial GuineaEritreaEstoniaEthiopiaFijiFinlandFranceGabonGambia, TheGeorgiaGermanyGhanaGreeceGrenadaGuatemalaGuineaGuinea-BissauGuyanaHaitiHondurasHong Kong SAR, ChinaHungaryIcelandIndiaIndonesiaIran, Islamic Rep.IraqIrelandIsraelItalyJamaicaJapanJordanKazakhstanKenyaKiribatiKorea, Rep.KosovoKuwaitKyrgyz RepublicLao PDRLatviaLebanonLesothoLiberiaLibyaLithuaniaLuxembourgMacao SAR, ChinaMacedonia, FYRMadagascarMalawiMalaysiaMaldivesMaliMaltaMauritaniaMauritiusMexicoMoldovaMongoliaMontenegroMoroccoMozambiqueNamibiaNepalNetherlandsNew ZealandNicaraguaNigerNigeriaNorwayOmanPakistanPanamaPapua New GuineaParaguayPeruPhilippinesPolandPortugalQatarRomaniaRussian FederationRwandaSaudi ArabiaSenegalSerbiaSeychellesSierra LeoneSingaporeSlovak RepublicSloveniaSolomon IslandsSouth AfricaSpainSri LankaSt. Kitts and NevisSt. LuciaSt. Vincent and the GrenadinesSudanSurinameSwazilandSwedenSwitzerlandSyrian Arab RepublicTajikistanTanzaniaThailandTimor-LesteTogoTongaTrinidad and TobagoTunisiaTurkeyTurkmenistanUgandaUkraineUnited KingdomUnited StatesUruguayVanuatuVenezuela, RBVietnamWest Bank and GazaYemen, Rep.ZambiaZimbabwe
Timeline:
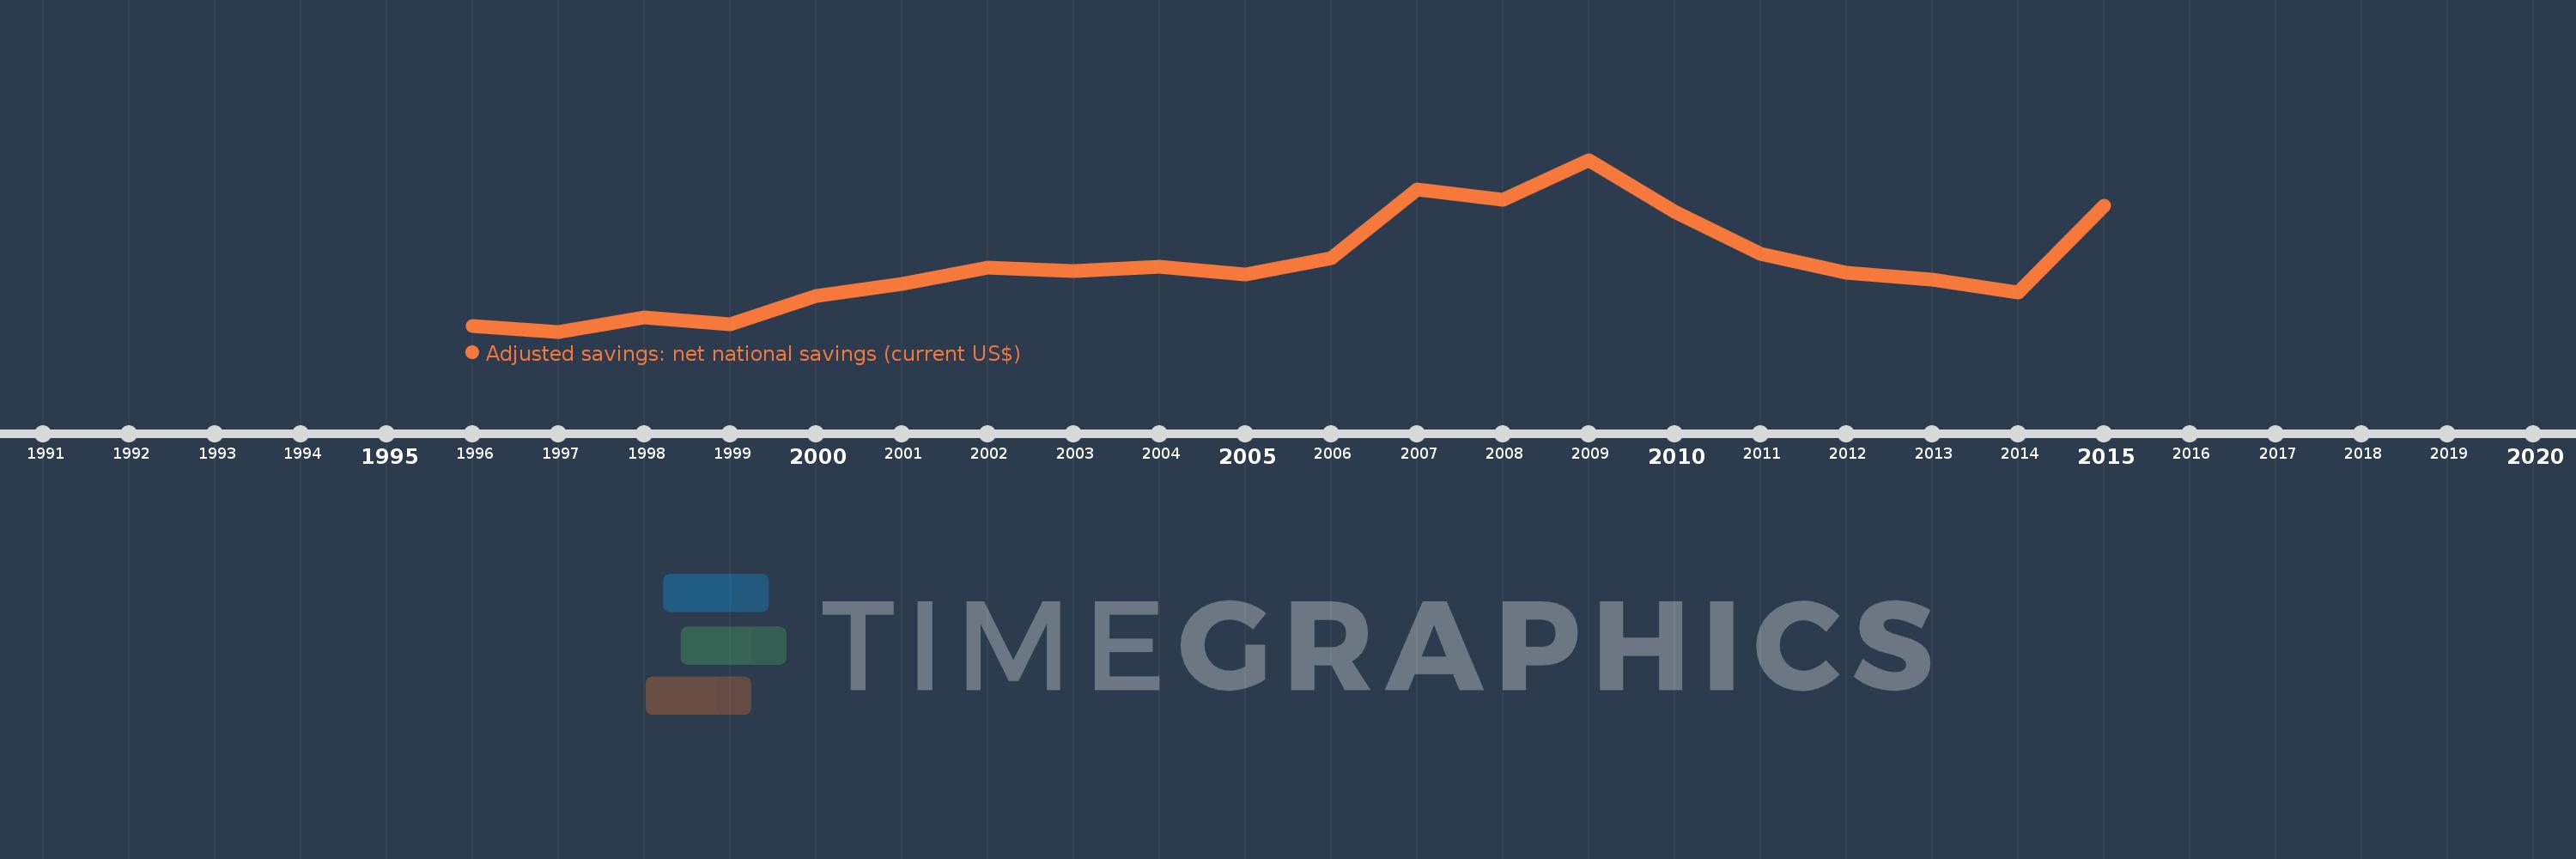
This timeline shows a graph from 1996 to 2015 of Cambodia. No data until 1995. Number of actual observations by date: 20.
Source name:
World Development Indicators
Source organization:
World Bank staff estimates based on sources and methods in World Bank's "The Changing Wealth of Nations: Measuring Sustainable Development in the New Millennium" (2011).
Categories, topics:
Economy & Growth, Environment
Last updated:
apr 23, 2017
Indicators value changes by year
Mean:
368.572 mln
Minimum:
-109.565 mln
jan 1, 1997
Maximum:
1.107 bln
jan 1, 2009
At the date of observation
Value
Absolute change
Change from previous value
jan 1, 1996
-68.843 mln
-68.843 mln
0.0%
jan 1, 1997
-109.565 mln
-40.722 mln
59.15%
jan 1, 1998
-8.164 mln
+101.401 mln
-92.55%
jan 1, 1999
-57.064 mln
-48.9 mln
598.99%
jan 1, 2000
141.232 mln
+198.295 mln
-347.5%
jan 1, 2001
230.94 mln
+89.708 mln
63.52%
jan 1, 2002
343.627 mln
+112.688 mln
48.8%
jan 1, 2003
318.594 mln
-25.034 mln
-7.29%
jan 1, 2004
349.806 mln
+31.213 mln
9.8%
jan 1, 2005
294.153 mln
-55.653 mln
-15.91%
jan 1, 2006
409.623 mln
+115.47 mln
39.25%
jan 1, 2007
899.844 mln
+490.221 mln
119.68%
jan 1, 2008
824.024 mln
-75.82 mln
-8.43%
jan 1, 2009
1.107 bln
+283.433 mln
34.4%
jan 1, 2010
741.601 mln
-365.857 mln
-33.04%
jan 1, 2011
441.593 mln
-300.008 mln
-40.45%
jan 1, 2012
304.808 mln
-136.784 mln
-30.98%
jan 1, 2013
261.213 mln
-43.596 mln
-14.3%
jan 1, 2014
165.67 mln
-95.542 mln
-36.58%
jan 1, 2015
780.887 mln
+615.217 mln
371.35%
Ranking of countries by current statistics by years

Comments:

Send
PremiumAbout & FeedbackTermsPrivacy
logo
© 2022 Selected Technologies LLC – Morgan Hill, California