29
/
en
AIzaSyAYiBZKx7MnpbEhh9jyipgxe19OcubqV5w
April 1, 2024
281880
Vietnam
VNM
true
2
1
Adjusted savings: net national savings (current US$)
2015,2014,2013,2012,2011,2010,2009,2008,2007,2006,2005,2004,2003,2002,2001,2000,1999,1998,1997
Download
Global statistics library →Vietnam →

Adjusted savings: net national savings (current US$)

This statistics in other country:
AfghanistanAlbaniaAlgeriaAngolaAntigua and BarbudaArgentinaArmeniaAustraliaAustriaAzerbaijanBahamas, TheBahrainBangladeshBarbadosBelarusBelgiumBelizeBeninBermudaBhutanBoliviaBosnia and HerzegovinaBotswanaBrazilBrunei DarussalamBulgariaBurkina FasoBurundiCabo VerdeCambodiaCameroonCanadaCentral African RepublicChadChileChinaColombiaComorosCongo, Dem. Rep.Congo, Rep.Costa RicaCote d'IvoireCroatiaCyprusCzech RepublicDenmarkDjiboutiDominicaDominican RepublicEcuadorEgypt, Arab Rep.El SalvadorEquatorial GuineaEritreaEstoniaEthiopiaFijiFinlandFranceGabonGambia, TheGeorgiaGermanyGhanaGreeceGrenadaGuatemalaGuineaGuinea-BissauGuyanaHaitiHondurasHong Kong SAR, ChinaHungaryIcelandIndiaIndonesiaIran, Islamic Rep.IraqIrelandIsraelItalyJamaicaJapanJordanKazakhstanKenyaKiribatiKorea, Rep.KosovoKuwaitKyrgyz RepublicLao PDRLatviaLebanonLesothoLiberiaLibyaLithuaniaLuxembourgMacao SAR, ChinaMacedonia, FYRMadagascarMalawiMalaysiaMaldivesMaliMaltaMauritaniaMauritiusMexicoMoldovaMongoliaMontenegroMoroccoMozambiqueNamibiaNepalNetherlandsNew ZealandNicaraguaNigerNigeriaNorwayOmanPakistanPanamaPapua New GuineaParaguayPeruPhilippinesPolandPortugalQatarRomaniaRussian FederationRwandaSaudi ArabiaSenegalSerbiaSeychellesSierra LeoneSingaporeSlovak RepublicSloveniaSolomon IslandsSouth AfricaSpainSri LankaSt. Kitts and NevisSt. LuciaSt. Vincent and the GrenadinesSudanSurinameSwazilandSwedenSwitzerlandSyrian Arab RepublicTajikistanTanzaniaThailandTimor-LesteTogoTongaTrinidad and TobagoTunisiaTurkeyTurkmenistanUgandaUkraineUnited KingdomUnited StatesUruguayVanuatuVenezuela, RBVietnamWest Bank and GazaYemen, Rep.ZambiaZimbabwe
Timeline:
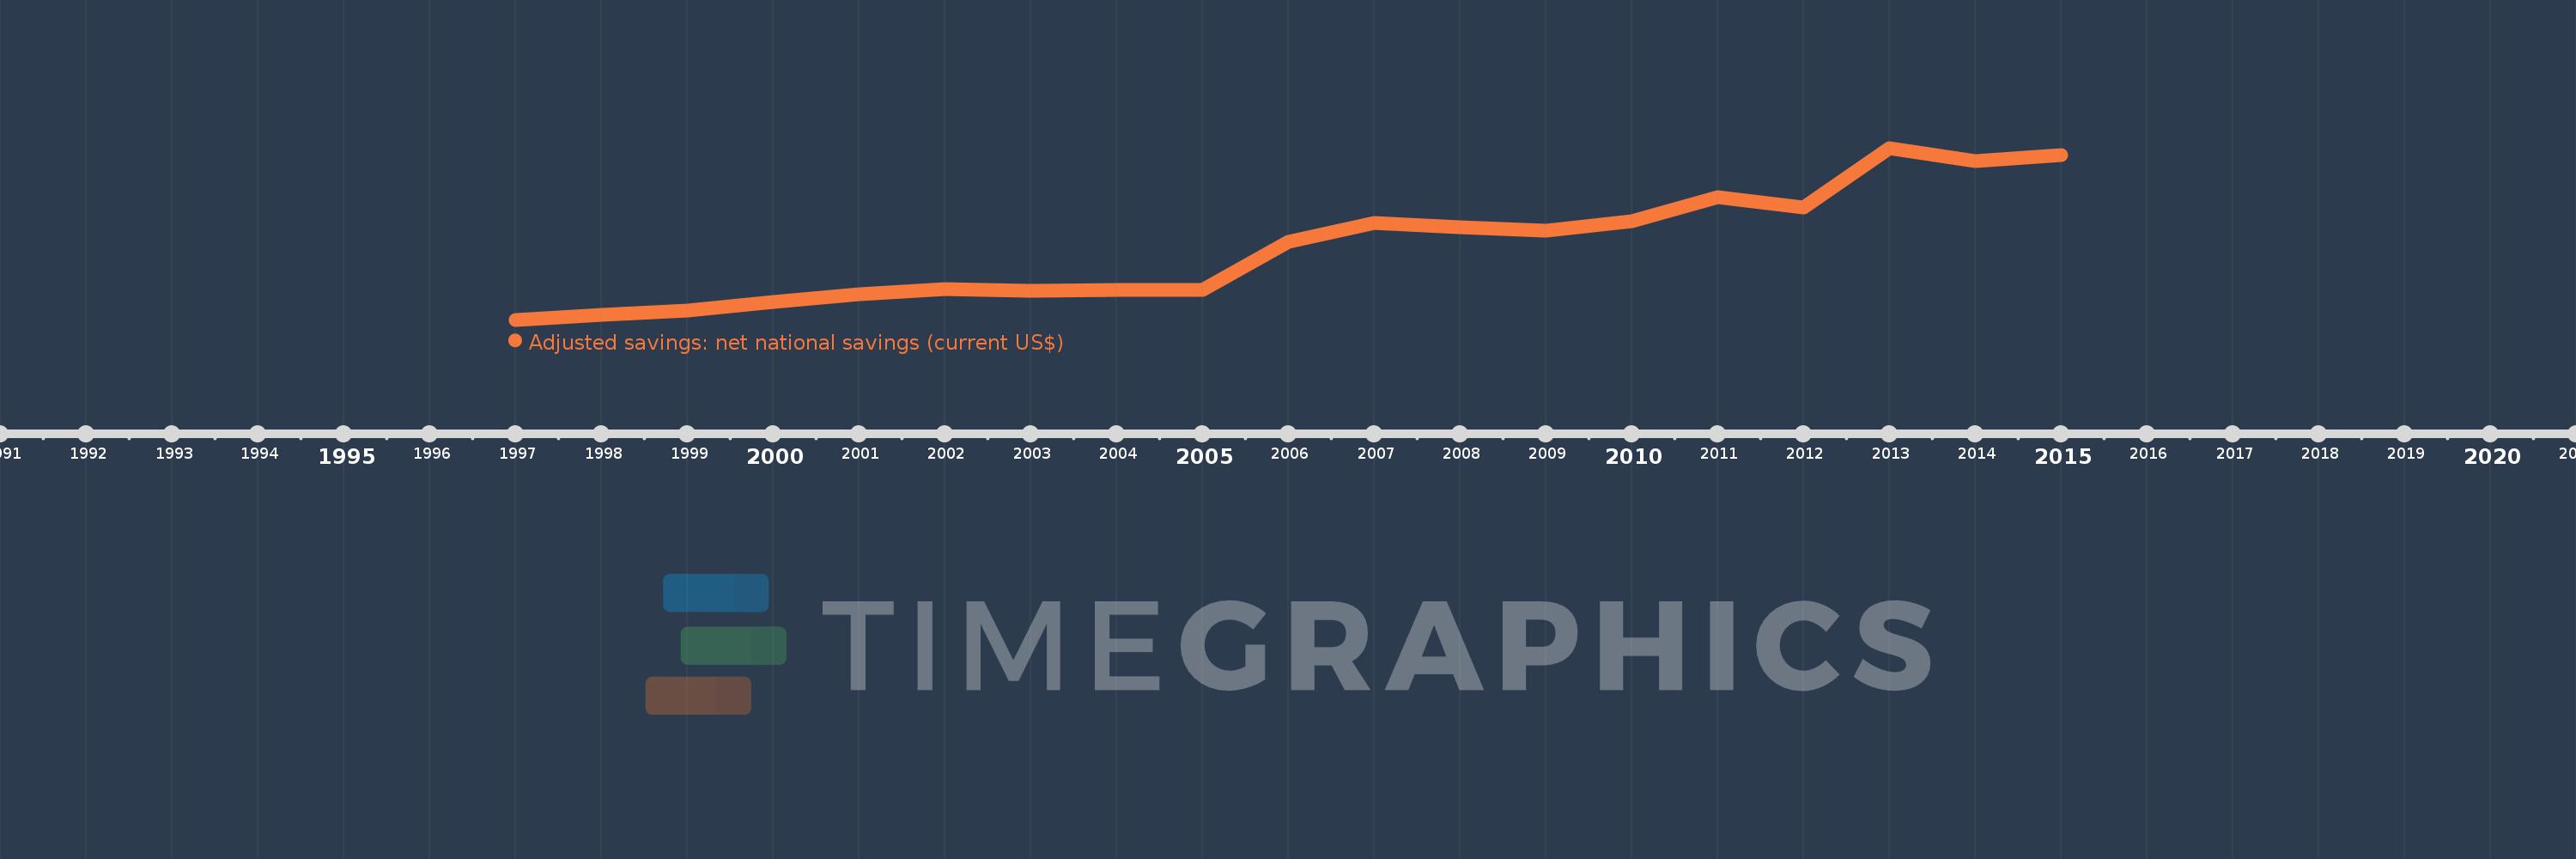
This timeline shows a graph from 1997 to 2015 of Vietnam. No data until 1996. Number of actual observations by date: 19.
Source name:
World Development Indicators
Source organization:
World Bank staff estimates based on sources and methods in World Bank's "The Changing Wealth of Nations: Measuring Sustainable Development in the New Millennium" (2011).
Categories, topics:
Economy & Growth, Environment
Last updated:
apr 23, 2017
Indicators value changes by year
Mean:
14.028 bln
Minimum:
4.117 bln
jan 1, 1997
Maximum:
27.891 bln
jan 1, 2013
At the date of observation
Value
Absolute change
Change from previous value
jan 1, 1997
4.117 bln
+4.117 bln
0.0%
jan 1, 1998
4.761 bln
+643.969 mln
15.64%
jan 1, 1999
5.382 bln
+621.165 mln
13.05%
jan 1, 2000
6.533 bln
+1.151 bln
21.4%
jan 1, 2001
7.649 bln
+1.115 bln
17.07%
jan 1, 2002
8.388 bln
+739.23 mln
9.67%
jan 1, 2003
8.074 bln
-313.853 mln
-3.74%
jan 1, 2004
8.274 bln
+200.028 mln
2.48%
jan 1, 2005
8.26 bln
-13.807 mln
-0.17%
jan 1, 2006
14.904 bln
+6.644 bln
80.44%
jan 1, 2007
17.517 bln
+2.613 bln
17.53%
jan 1, 2008
16.971 bln
-545.571 mln
-3.11%
jan 1, 2009
16.41 bln
-561.284 mln
-3.31%
jan 1, 2010
17.8 bln
+1.39 bln
8.47%
jan 1, 2011
21.045 bln
+3.245 bln
18.23%
jan 1, 2012
19.603 bln
-1.442 bln
-6.85%
jan 1, 2013
27.891 bln
+8.288 bln
42.28%
jan 1, 2014
26.033 bln
-1.858 bln
-6.66%
jan 1, 2015
26.918 bln
+884.35 mln
3.4%
Ranking of countries by current statistics by years

Comments:

Send
PremiumAbout & FeedbackTermsPrivacy
logo
© 2022 Selected Technologies LLC – Morgan Hill, California