29
/
en
AIzaSyAYiBZKx7MnpbEhh9jyipgxe19OcubqV5w
April 1, 2024
117598
Czech Republic
CZE
true
2
1
Adjusted savings: net national savings (current US$)
2015,2014,2013,2012,2011,2010,2009,2008,2007,2006,2005,2004,2003,2002,2001,2000,1999,1998,1997,1996,1995,1994
Download
Global statistics library →Czech Republic →

Adjusted savings: net national savings (current US$)

This statistics in other country:
AfghanistanAlbaniaAlgeriaAngolaAntigua and BarbudaArgentinaArmeniaAustraliaAustriaAzerbaijanBahamas, TheBahrainBangladeshBarbadosBelarusBelgiumBelizeBeninBermudaBhutanBoliviaBosnia and HerzegovinaBotswanaBrazilBrunei DarussalamBulgariaBurkina FasoBurundiCabo VerdeCambodiaCameroonCanadaCentral African RepublicChadChileChinaColombiaComorosCongo, Dem. Rep.Congo, Rep.Costa RicaCote d'IvoireCroatiaCyprusCzech RepublicDenmarkDjiboutiDominicaDominican RepublicEcuadorEgypt, Arab Rep.El SalvadorEquatorial GuineaEritreaEstoniaEthiopiaFijiFinlandFranceGabonGambia, TheGeorgiaGermanyGhanaGreeceGrenadaGuatemalaGuineaGuinea-BissauGuyanaHaitiHondurasHong Kong SAR, ChinaHungaryIcelandIndiaIndonesiaIran, Islamic Rep.IraqIrelandIsraelItalyJamaicaJapanJordanKazakhstanKenyaKiribatiKorea, Rep.KosovoKuwaitKyrgyz RepublicLao PDRLatviaLebanonLesothoLiberiaLibyaLithuaniaLuxembourgMacao SAR, ChinaMacedonia, FYRMadagascarMalawiMalaysiaMaldivesMaliMaltaMauritaniaMauritiusMexicoMoldovaMongoliaMontenegroMoroccoMozambiqueNamibiaNepalNetherlandsNew ZealandNicaraguaNigerNigeriaNorwayOmanPakistanPanamaPapua New GuineaParaguayPeruPhilippinesPolandPortugalQatarRomaniaRussian FederationRwandaSaudi ArabiaSenegalSerbiaSeychellesSierra LeoneSingaporeSlovak RepublicSloveniaSolomon IslandsSouth AfricaSpainSri LankaSt. Kitts and NevisSt. LuciaSt. Vincent and the GrenadinesSudanSurinameSwazilandSwedenSwitzerlandSyrian Arab RepublicTajikistanTanzaniaThailandTimor-LesteTogoTongaTrinidad and TobagoTunisiaTurkeyTurkmenistanUgandaUkraineUnited KingdomUnited StatesUruguayVanuatuVenezuela, RBVietnamWest Bank and GazaYemen, Rep.ZambiaZimbabwe
Timeline:
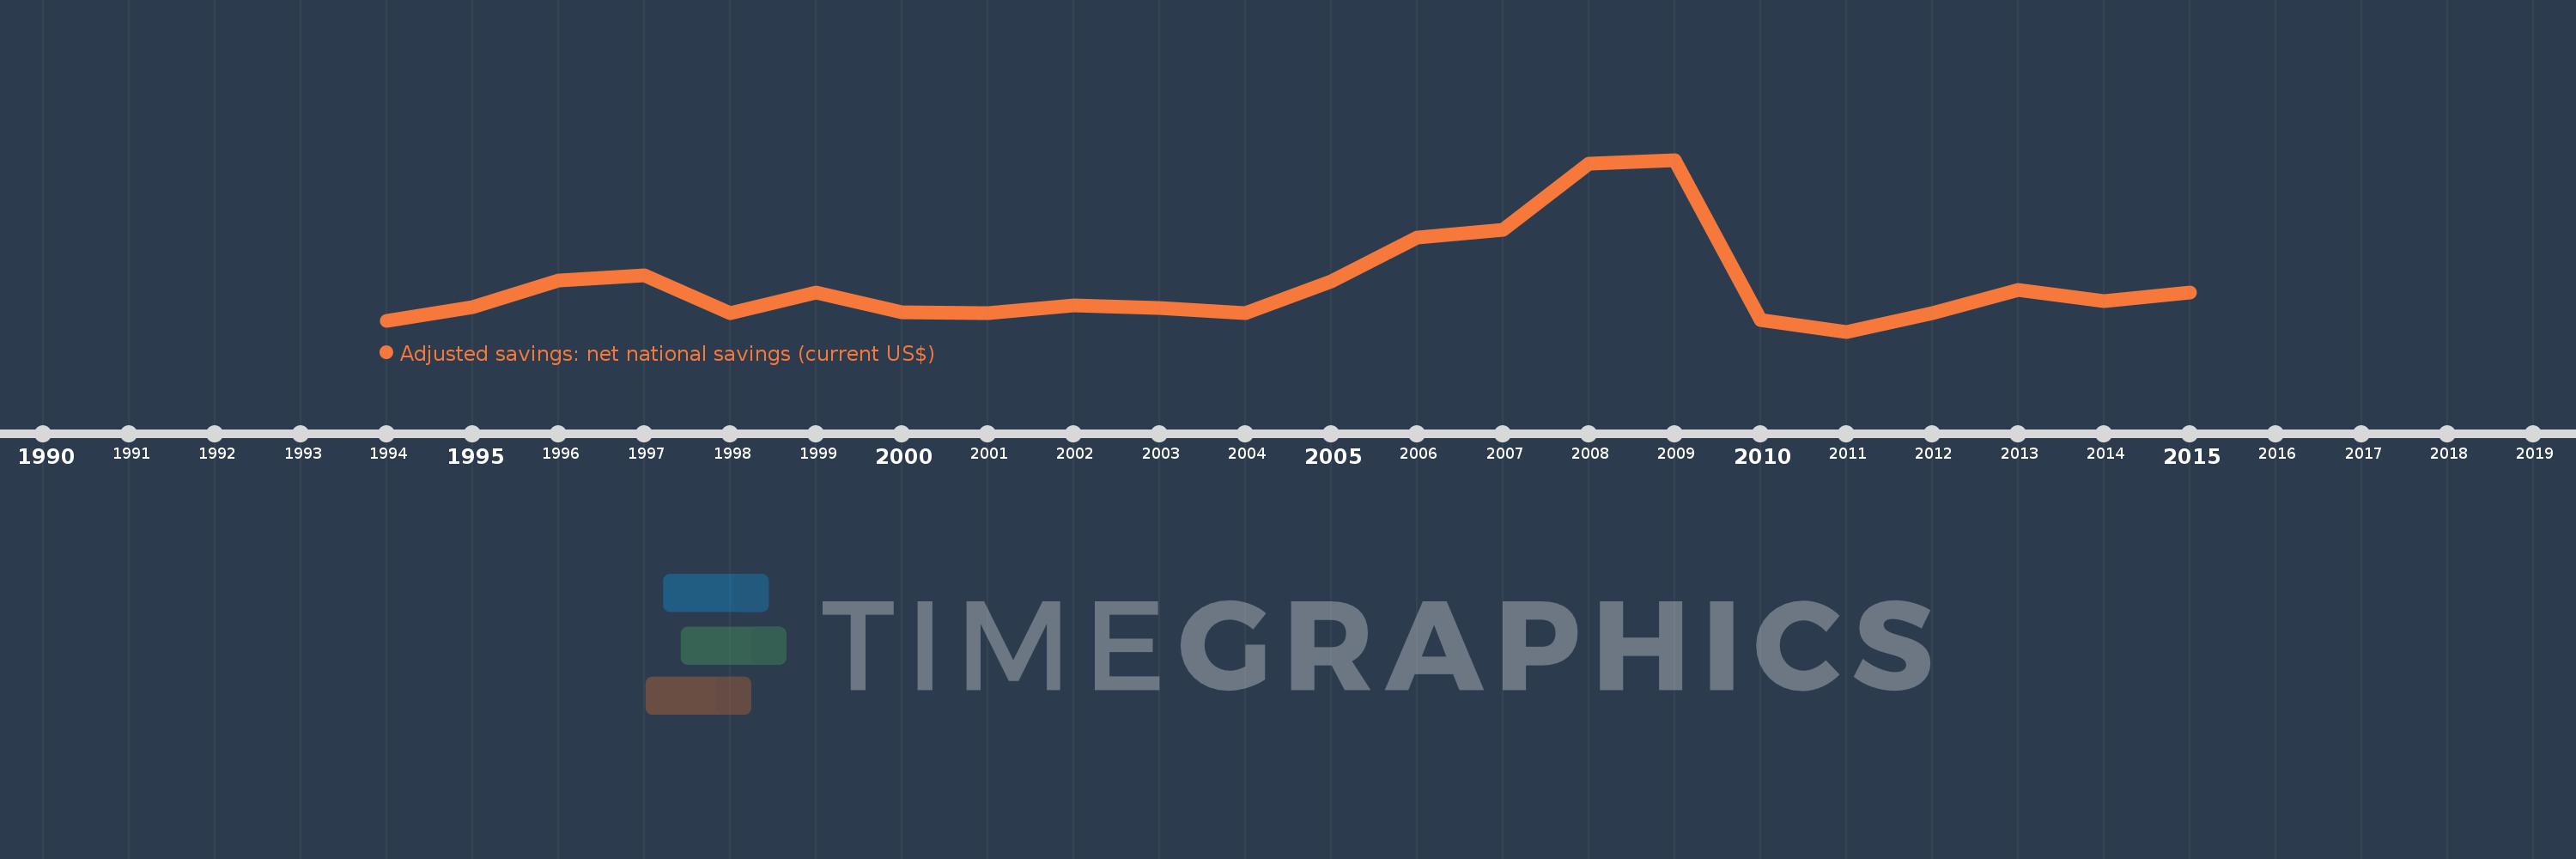
This timeline shows a graph from 1994 to 2015 of Czech Republic. No data until 1993. Number of actual observations by date: 22.
Source name:
World Development Indicators
Source organization:
World Bank staff estimates based on sources and methods in World Bank's "The Changing Wealth of Nations: Measuring Sustainable Development in the New Millennium" (2011).
Categories, topics:
Economy & Growth, Environment
Last updated:
apr 23, 2017
Indicators value changes by year
Mean:
5.519 bln
Minimum:
2.034 bln
jan 1, 2011
Maximum:
14.798 bln
jan 1, 2009
At the date of observation
Value
Absolute change
Change from previous value
jan 1, 1994
2.821 bln
+2.821 bln
0.0%
jan 1, 1995
3.822 bln
+1.001 bln
35.5%
jan 1, 1996
5.843 bln
+2.021 bln
52.87%
jan 1, 1997
6.235 bln
+392.308 mln
6.71%
jan 1, 1998
3.389 bln
-2.846 bln
-45.65%
jan 1, 1999
4.918 bln
+1.53 bln
45.14%
jan 1, 2000
3.47 bln
-1.448 bln
-29.45%
jan 1, 2001
3.408 bln
-61.628 mln
-1.78%
jan 1, 2002
4.002 bln
+593.394 mln
17.41%
jan 1, 2003
3.783 bln
-219.218 mln
-5.48%
jan 1, 2004
3.417 bln
-365.608 mln
-9.67%
jan 1, 2005
5.745 bln
+2.328 bln
68.12%
jan 1, 2006
9.042 bln
+3.298 bln
57.41%
jan 1, 2007
9.578 bln
+535.776 mln
5.93%
jan 1, 2008
14.504 bln
+4.926 bln
51.43%
jan 1, 2009
14.798 bln
+293.722 mln
2.03%
jan 1, 2010
2.886 bln
-11.912 bln
-80.5%
jan 1, 2011
2.034 bln
-851.792 mln
-29.52%
jan 1, 2012
3.389 bln
+1.355 bln
66.62%
jan 1, 2013
5.151 bln
+1.761 bln
51.98%
jan 1, 2014
4.272 bln
-878.908 mln
-17.06%
jan 1, 2015
4.914 bln
+642.262 mln
15.04%
Ranking of countries by current statistics by years

Comments:

Send
PremiumAbout & FeedbackTermsPrivacy
logo
© 2022 Selected Technologies LLC – Morgan Hill, California