29
/
en
AIzaSyAYiBZKx7MnpbEhh9jyipgxe19OcubqV5w
April 1, 2024
181813
Luxembourg
LUX
true
2
1
Adjusted savings: net national savings (current US$)
2015,2014,2013,2012,2011,2010,2009,2008,2007,2006,2005,2004,2003,2002,2001,2000,1999,1998,1997,1996
Download
Global statistics library →Luxembourg →

Adjusted savings: net national savings (current US$)

This statistics in other country:
AfghanistanAlbaniaAlgeriaAngolaAntigua and BarbudaArgentinaArmeniaAustraliaAustriaAzerbaijanBahamas, TheBahrainBangladeshBarbadosBelarusBelgiumBelizeBeninBermudaBhutanBoliviaBosnia and HerzegovinaBotswanaBrazilBrunei DarussalamBulgariaBurkina FasoBurundiCabo VerdeCambodiaCameroonCanadaCentral African RepublicChadChileChinaColombiaComorosCongo, Dem. Rep.Congo, Rep.Costa RicaCote d'IvoireCroatiaCyprusCzech RepublicDenmarkDjiboutiDominicaDominican RepublicEcuadorEgypt, Arab Rep.El SalvadorEquatorial GuineaEritreaEstoniaEthiopiaFijiFinlandFranceGabonGambia, TheGeorgiaGermanyGhanaGreeceGrenadaGuatemalaGuineaGuinea-BissauGuyanaHaitiHondurasHong Kong SAR, ChinaHungaryIcelandIndiaIndonesiaIran, Islamic Rep.IraqIrelandIsraelItalyJamaicaJapanJordanKazakhstanKenyaKiribatiKorea, Rep.KosovoKuwaitKyrgyz RepublicLao PDRLatviaLebanonLesothoLiberiaLibyaLithuaniaLuxembourgMacao SAR, ChinaMacedonia, FYRMadagascarMalawiMalaysiaMaldivesMaliMaltaMauritaniaMauritiusMexicoMoldovaMongoliaMontenegroMoroccoMozambiqueNamibiaNepalNetherlandsNew ZealandNicaraguaNigerNigeriaNorwayOmanPakistanPanamaPapua New GuineaParaguayPeruPhilippinesPolandPortugalQatarRomaniaRussian FederationRwandaSaudi ArabiaSenegalSerbiaSeychellesSierra LeoneSingaporeSlovak RepublicSloveniaSolomon IslandsSouth AfricaSpainSri LankaSt. Kitts and NevisSt. LuciaSt. Vincent and the GrenadinesSudanSurinameSwazilandSwedenSwitzerlandSyrian Arab RepublicTajikistanTanzaniaThailandTimor-LesteTogoTongaTrinidad and TobagoTunisiaTurkeyTurkmenistanUgandaUkraineUnited KingdomUnited StatesUruguayVanuatuVenezuela, RBVietnamWest Bank and GazaYemen, Rep.ZambiaZimbabwe
Timeline:
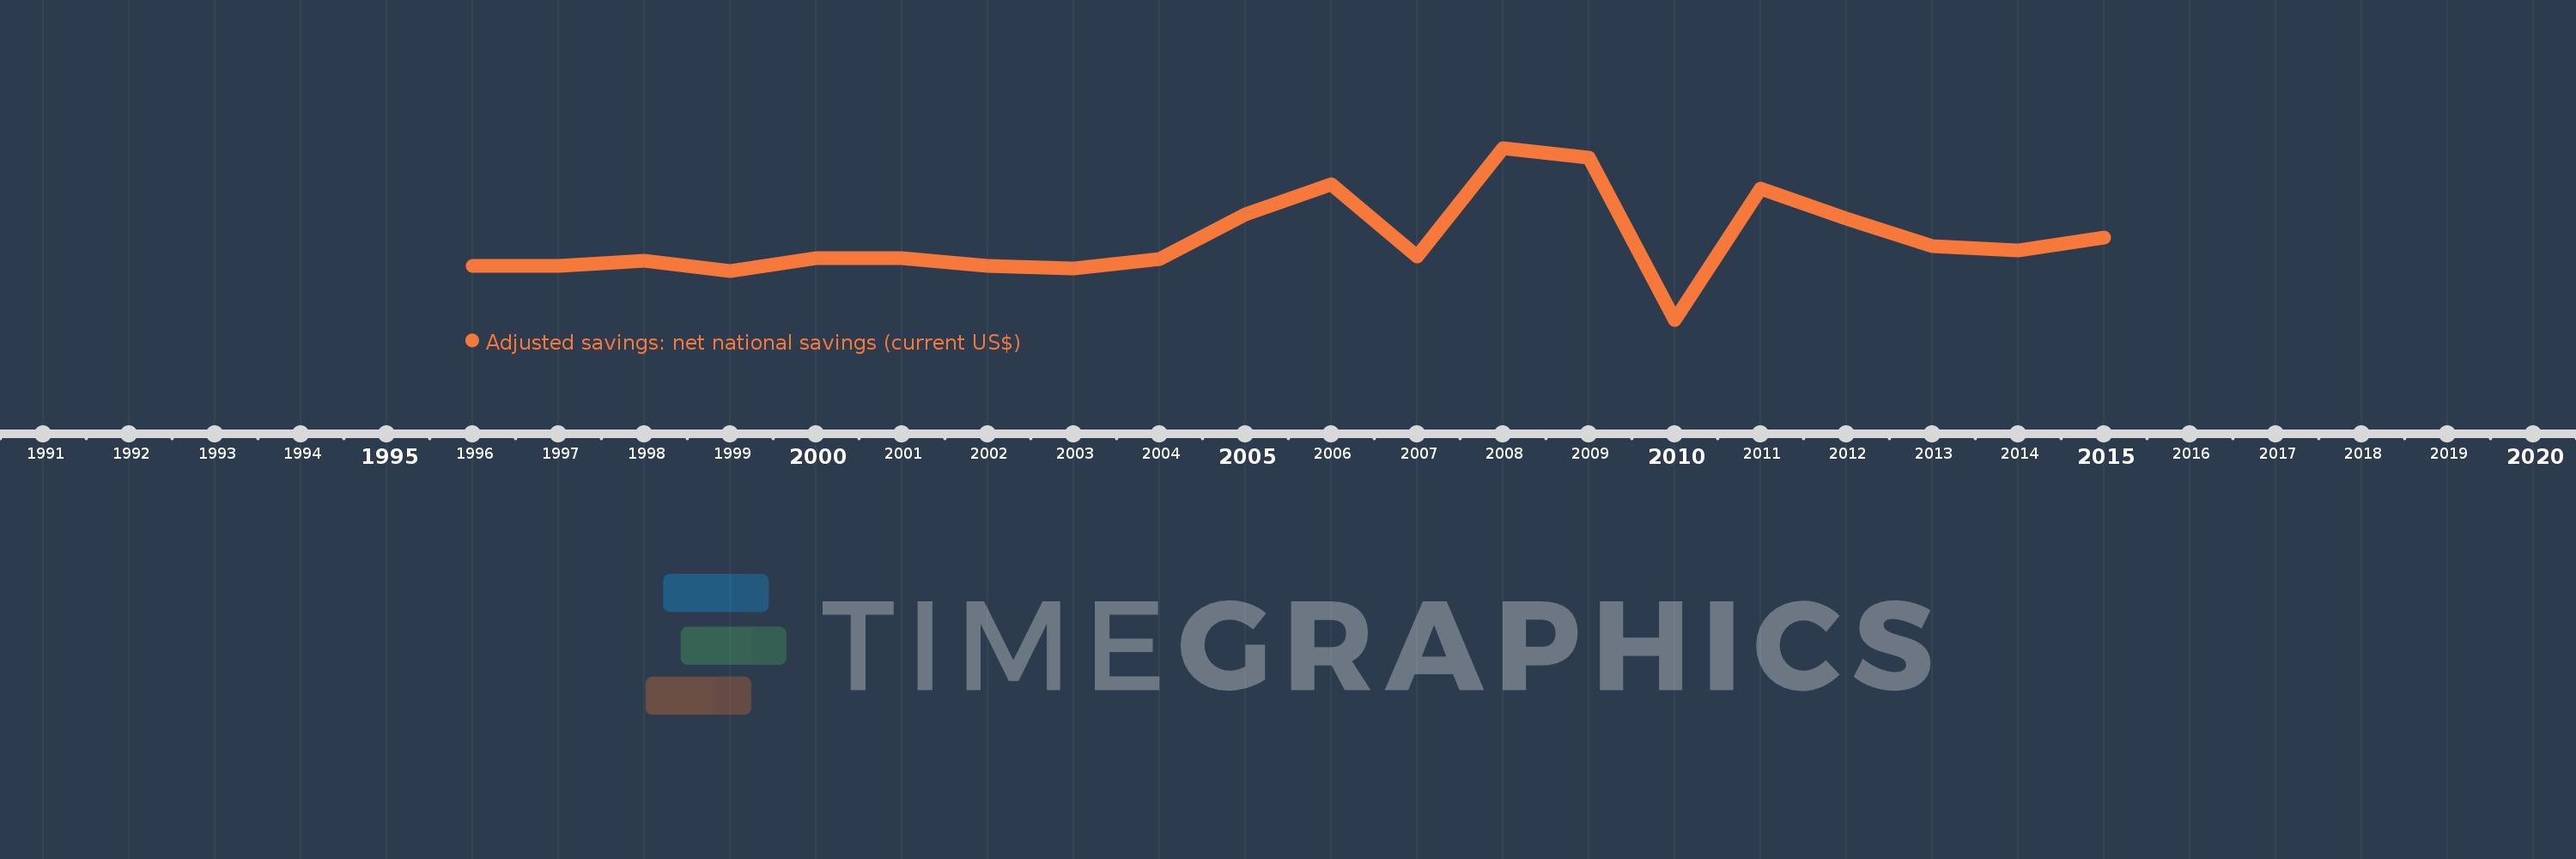
This timeline shows a graph from 1996 to 2015 of Luxembourg. No data until 1995. Number of actual observations by date: 20.
Source name:
World Development Indicators
Source organization:
World Bank staff estimates based on sources and methods in World Bank's "The Changing Wealth of Nations: Measuring Sustainable Development in the New Millennium" (2011).
Categories, topics:
Economy & Growth, Environment
Last updated:
apr 23, 2017
Indicators value changes by year
Mean:
3.827 bln
Minimum:
-29.001 mln
jan 1, 2010
Maximum:
8.252 bln
jan 1, 2008
At the date of observation
Value
Absolute change
Change from previous value
jan 1, 1996
2.557 bln
+2.557 bln
0.0%
jan 1, 1997
2.587 bln
+30.514 mln
1.19%
jan 1, 1998
2.799 bln
+212.102 mln
8.2%
jan 1, 1999
2.329 bln
-470.595 mln
-16.81%
jan 1, 2000
2.944 bln
+615.765 mln
26.44%
jan 1, 2001
2.954 bln
+9.198 mln
0.31%
jan 1, 2002
2.573 bln
-380.455 mln
-12.88%
jan 1, 2003
2.438 bln
-135.288 mln
-5.26%
jan 1, 2004
2.884 bln
+446.217 mln
18.3%
jan 1, 2005
5.046 bln
+2.162 bln
74.98%
jan 1, 2006
6.485 bln
+1.438 bln
28.5%
jan 1, 2007
3.032 bln
-3.452 bln
-53.24%
jan 1, 2008
8.252 bln
+5.22 bln
172.15%
jan 1, 2009
7.794 bln
-458.296 mln
-5.55%
jan 1, 2010
-29.001 mln
-7.823 bln
-100.37%
jan 1, 2011
6.311 bln
+6.34 bln
-21.86K%
jan 1, 2012
4.85 bln
-1.46 bln
-23.14%
jan 1, 2013
3.501 bln
-1.35 bln
-27.83%
jan 1, 2014
3.317 bln
-183.857 mln
-5.25%
jan 1, 2015
3.925 bln
+608.098 mln
18.33%
Ranking of countries by current statistics by years

Comments:

Send
PremiumAbout & FeedbackTermsPrivacy
logo
© 2022 Selected Technologies LLC – Morgan Hill, California