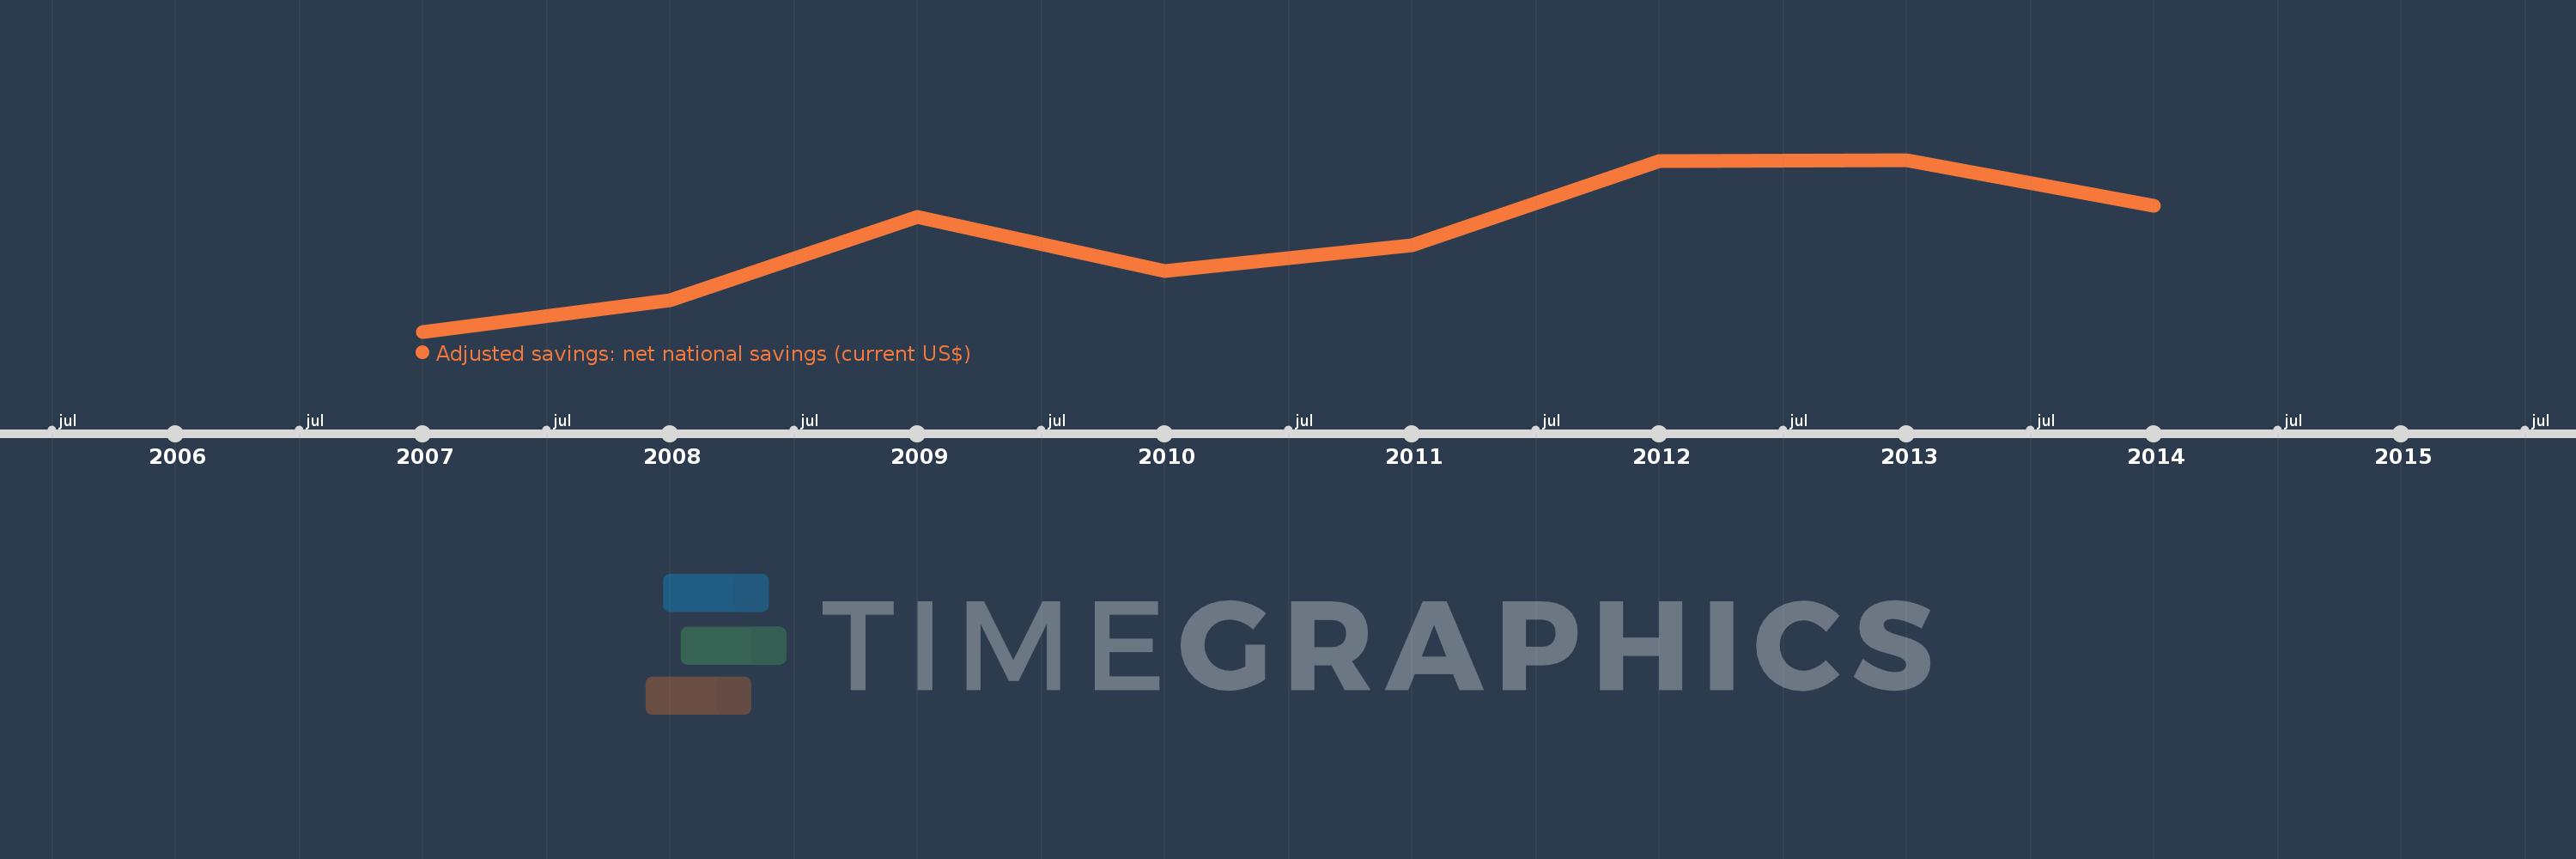
This timeline shows a graph from 2007 to 2014 of Timor-Leste. No data until 2006. Number of actual observations by date: 8.
Source name:
World Development Indicators
Source organization:
World Bank staff estimates based on sources and methods in World Bank's "The Changing Wealth of Nations: Measuring Sustainable Development in the New Millennium" (2011).
Categories, topics:
Economy & Growth, Environment
Last updated:
apr 23, 2017
Indicators value changes by year
Meaning:
2.058 bln
Minimum:
669.405 mln
jan 1, 2007
Maximum:
3.173 bln
jan 1, 2013
At the date of observation
Value
Absolute change
Change from the previous value
jan 1, 2007
669.405 mln
+669.405 mln
0.0%
jan 1, 2008
1.131 bln
+461.545 mln
68.95%
jan 1, 2009
2.342 bln
+1.212 bln
107.13%
jan 1, 2010
1.557 bln
-785.109 mln
-33.52%
jan 1, 2011
1.926 bln
+368.893 mln
23.69%
jan 1, 2012
3.153 bln
+1.226 bln
63.67%
jan 1, 2013
3.173 bln
+20.101 mln
0.64%
jan 1, 2014
2.509 bln
-664.136 mln
-20.93%
Ranking of countries by current statistics by years