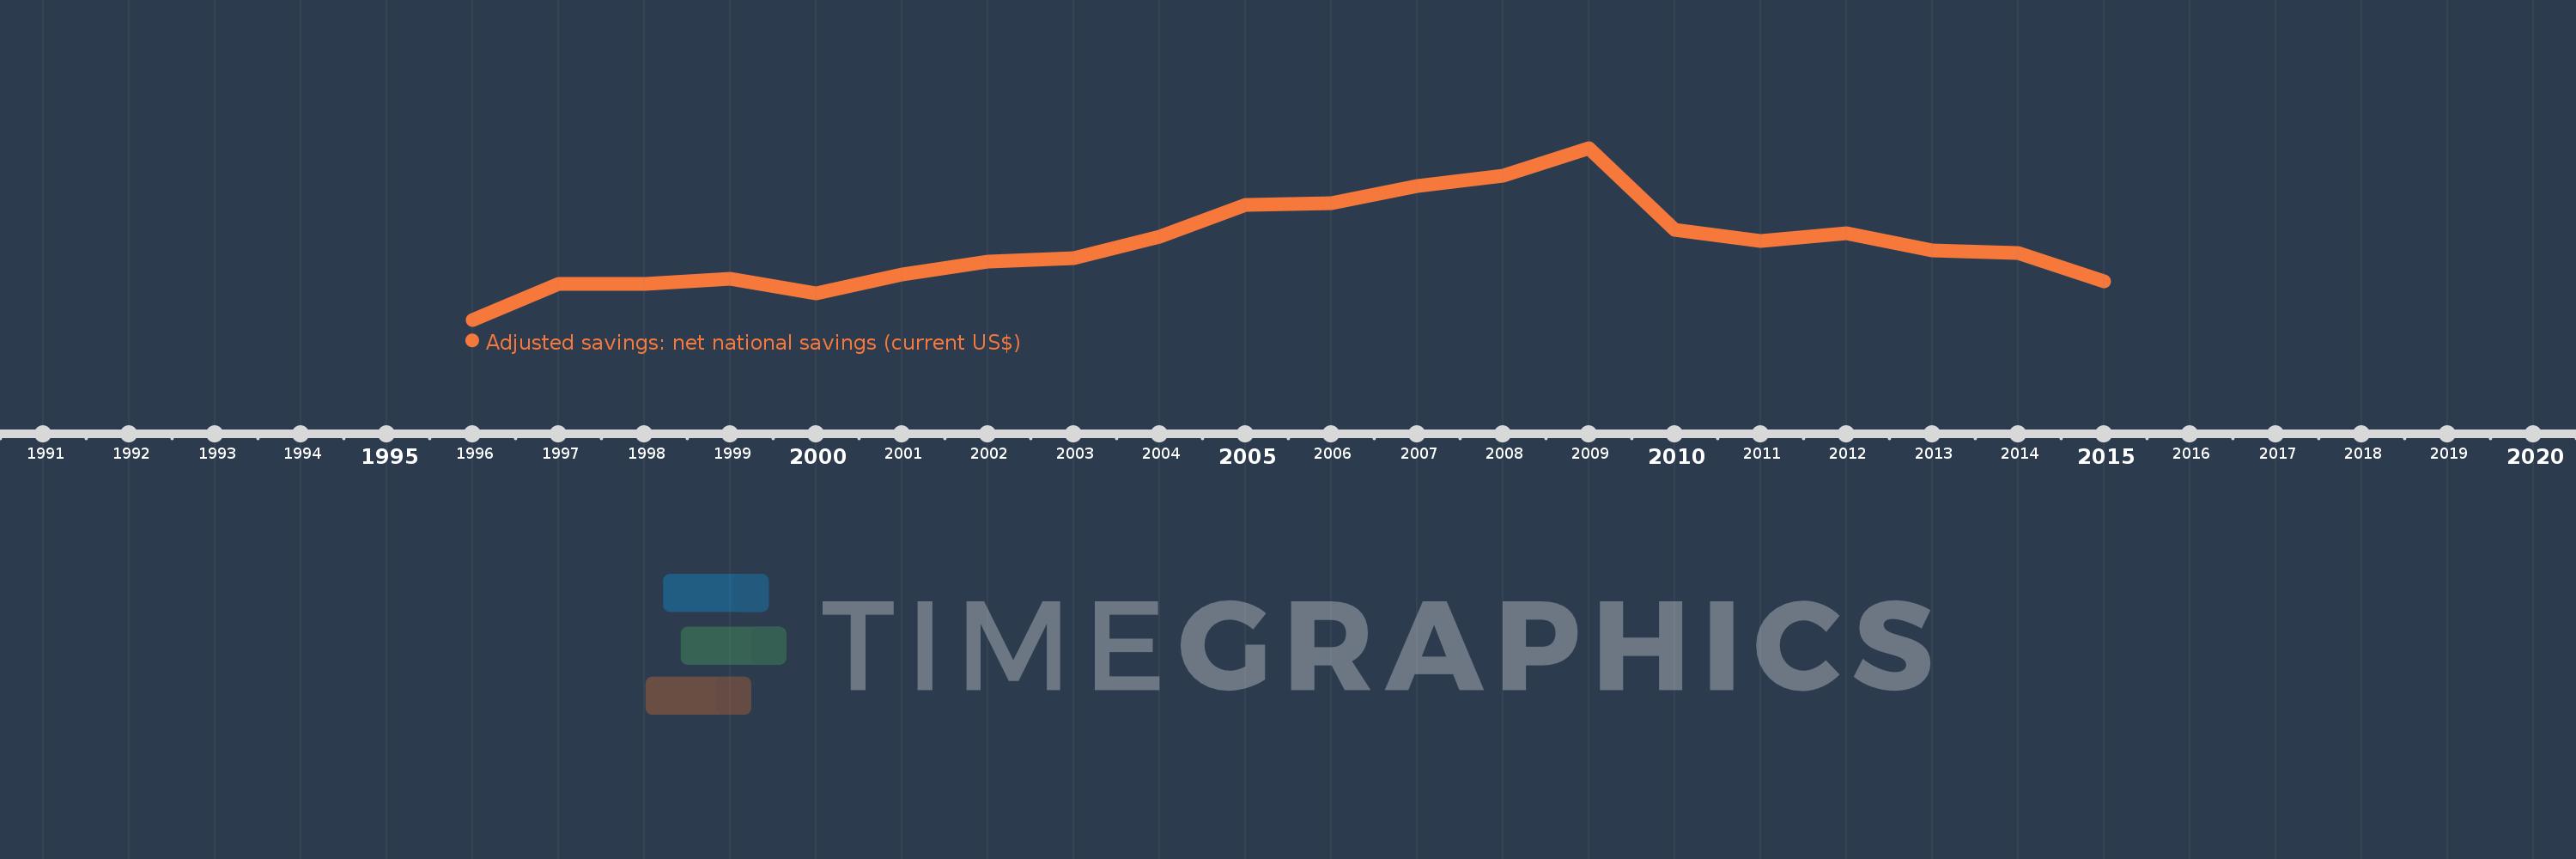
This timeline shows a graph from 1996 to 2015 of Croatia. No data until 1995. Number of actual observations by date: 20.
Source name:
World Development Indicators
Source organization:
World Bank staff estimates based on sources and methods in World Bank's "The Changing Wealth of Nations: Measuring Sustainable Development in the New Millennium" (2011).
Categories, topics:
Economy & Growth, Environment
Last updated:
apr 23, 2017
Indicators value changes by year
Meaning:
2.041 bln
Minimum:
-848.212 mln
jan 1, 1996
Maximum:
5.782 bln
jan 1, 2009
At the date of observation
Value
Absolute change
Change from the previous value
jan 1, 1996
-848.212 mln
-848.212 mln
0.0%
jan 1, 1997
536.038 mln
+1.384 bln
-163.2%
jan 1, 1998
538.928 mln
+2.891 mln
0.54%
jan 1, 1999
736.299 mln
+197.371 mln
36.62%
jan 1, 2000
181.342 mln
-554.957 mln
-75.37%
jan 1, 2001
913.885 mln
+732.542 mln
403.96%
jan 1, 2002
1.392 bln
+478.521 mln
52.36%
jan 1, 2003
1.515 bln
+123.067 mln
8.84%
jan 1, 2004
2.342 bln
+826.357 mln
54.53%
jan 1, 2005
3.592 bln
+1.25 bln
53.38%
jan 1, 2006
3.665 bln
+73.078 mln
2.03%
jan 1, 2007
4.305 bln
+639.534 mln
17.45%
jan 1, 2008
4.718 bln
+413.911 mln
9.62%
jan 1, 2009
5.782 bln
+1.064 bln
22.55%
jan 1, 2010
2.613 bln
-3.17 bln
-54.81%
jan 1, 2011
2.181 bln
-432.103 mln
-16.54%
jan 1, 2012
2.493 bln
+312.155 mln
14.31%
jan 1, 2013
1.822 bln
-670.822 mln
-26.91%
jan 1, 2014
1.723 bln
-99.308 mln
-5.45%
jan 1, 2015
624.59 mln
-1.098 bln
-63.74%
Ranking of countries by current statistics by years