33
/
AIzaSyAYiBZKx7MnpbEhh9jyipgxe19OcubqV5w
August 1, 2025
220415
Paraguay
PRY
true
2
1
Adjusted savings: net national savings (current US$)
2015,2014,2013,2012,2011,2010,2009,2008,2007,2006,2005,2004,2003,2002,2001,2000,1999,1998,1997,1996
Download
Global statistics library →Paraguay →

Adjusted savings: net national savings (current US$)

This statistics in other country:

AfghanistanAlbaniaAlgeriaAngolaAntigua and BarbudaArgentinaArmeniaAustraliaAustriaAzerbaijanBahamas, TheBahrainBangladeshBarbadosBelarusBelgiumBelizeBeninBermudaBhutanBoliviaBosnia and HerzegovinaBotswanaBrazilBrunei DarussalamBulgariaBurkina FasoBurundiCabo VerdeCambodiaCameroonCanadaCentral African RepublicChadChileChinaColombiaComorosCongo, Dem. Rep.Congo, Rep.Costa RicaCote d'IvoireCroatiaCyprusCzech RepublicDenmarkDjiboutiDominicaDominican RepublicEcuadorEgypt, Arab Rep.El SalvadorEquatorial GuineaEritreaEstoniaEthiopiaFijiFinlandFranceGabonGambia, TheGeorgiaGermanyGhanaGreeceGrenadaGuatemalaGuineaGuinea-BissauGuyanaHaitiHondurasHong Kong SAR, ChinaHungaryIcelandIndiaIndonesiaIran, Islamic Rep.IraqIrelandIsraelItalyJamaicaJapanJordanKazakhstanKenyaKiribatiKorea, Rep.KosovoKuwaitKyrgyz RepublicLao PDRLatviaLebanonLesothoLiberiaLibyaLithuaniaLuxembourgMacao SAR, ChinaMacedonia, FYRMadagascarMalawiMalaysiaMaldivesMaliMaltaMauritaniaMauritiusMexicoMoldovaMongoliaMontenegroMoroccoMozambiqueNamibiaNepalNetherlandsNew ZealandNicaraguaNigerNigeriaNorwayOmanPakistanPanamaPapua New GuineaParaguayPeruPhilippinesPolandPortugalQatarRomaniaRussian FederationRwandaSaudi ArabiaSenegalSerbiaSeychellesSierra LeoneSingaporeSlovak RepublicSloveniaSolomon IslandsSouth AfricaSpainSri LankaSt. Kitts and NevisSt. LuciaSt. Vincent and the GrenadinesSudanSurinameSwazilandSwedenSwitzerlandSyrian Arab RepublicTajikistanTanzaniaThailandTimor-LesteTogoTongaTrinidad and TobagoTunisiaTurkeyTurkmenistanUgandaUkraineUnited KingdomUnited StatesUruguayVanuatuVenezuela, RBVietnamWest Bank and GazaYemen, Rep.ZambiaZimbabwe

Timeline:

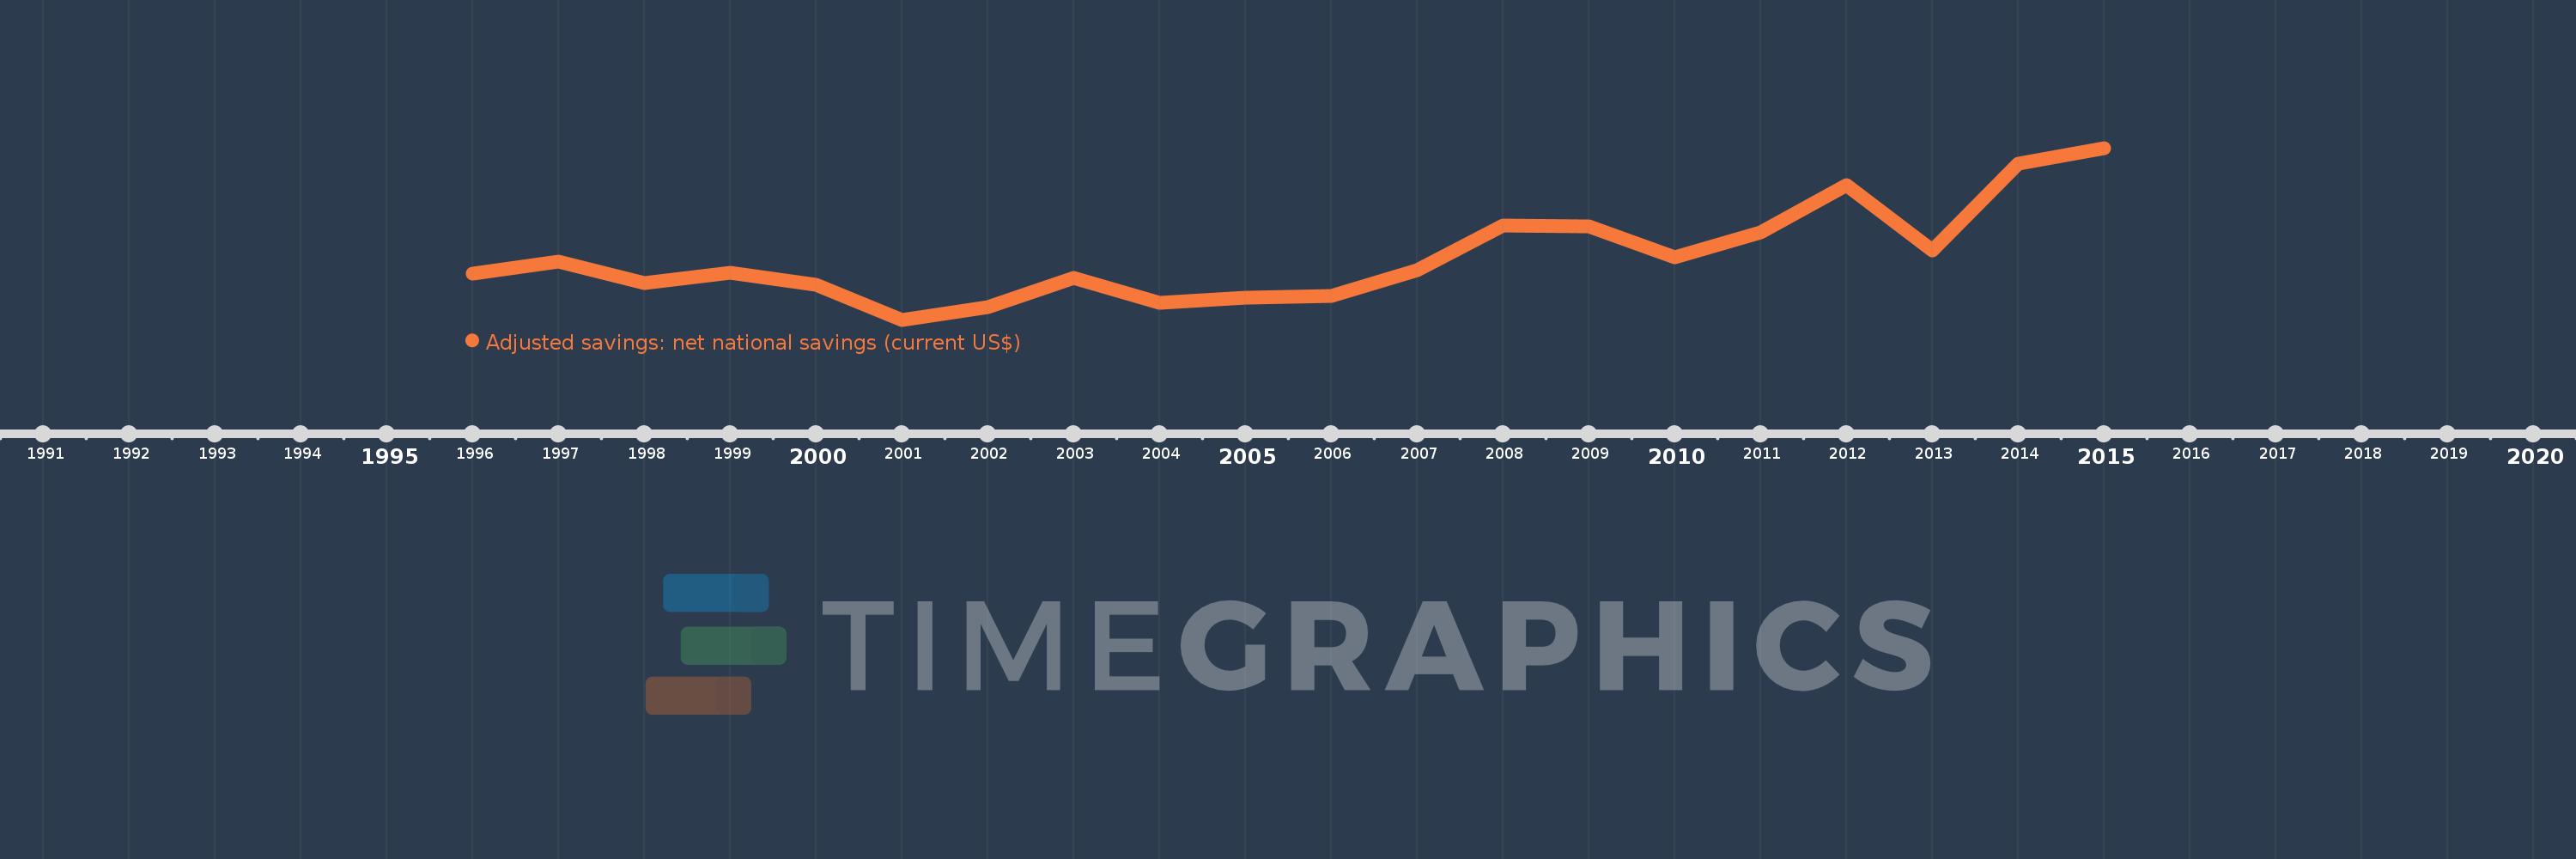
This timeline shows a graph from 1996 to 2015 of Paraguay. No data until 1995. Number of actual observations by date: 20.

Source name:

World Development Indicators

Source organization:

World Bank staff estimates based on sources and methods in World Bank's "The Changing Wealth of Nations: Measuring Sustainable Development in the New Millennium" (2011).

Categories, topics:

Economy & Growth, Environment

Last updated:

apr 23, 2017

Indicators value changes by year

Meaning:
1.372 bln
Minimum:
298.941 mln
jan 1, 2001
Maximum:
3.225 bln
jan 1, 2015
At the date of observation
Value
Absolute change
Change from the previous value
jan 1, 1996
1.085 bln
+1.085 bln
0.0%
jan 1, 1997
1.294 bln
+209.062 mln
19.26%
jan 1, 1998
916.484 mln
-378.004 mln
-29.2%
jan 1, 1999
1.094 bln
+177.642 mln
19.38%
jan 1, 2000
892.699 mln
-201.427 mln
-18.41%
jan 1, 2001
298.941 mln
-593.758 mln
-66.51%
jan 1, 2002
509.097 mln
+210.156 mln
70.3%
jan 1, 2003
1.019 bln
+509.575 mln
100.09%
jan 1, 2004
593.954 mln
-424.718 mln
-41.69%
jan 1, 2005
677.889 mln
+83.935 mln
14.13%
jan 1, 2006
705.211 mln
+27.322 mln
4.03%
jan 1, 2007
1.148 bln
+442.391 mln
62.73%
jan 1, 2008
1.911 bln
+763.1 mln
66.5%
jan 1, 2009
1.893 bln
-17.396 mln
-0.91%
jan 1, 2010
1.355 bln
-537.951 mln
-28.41%
jan 1, 2011
1.783 bln
+427.177 mln
31.52%
jan 1, 2012
2.598 bln
+815.687 mln
45.76%
jan 1, 2013
1.473 bln
-1.125 bln
-43.29%
jan 1, 2014
2.96 bln
+1.486 bln
100.87%
jan 1, 2015
3.225 bln
+265.531 mln
8.97%

Ranking of countries by current statistics by years