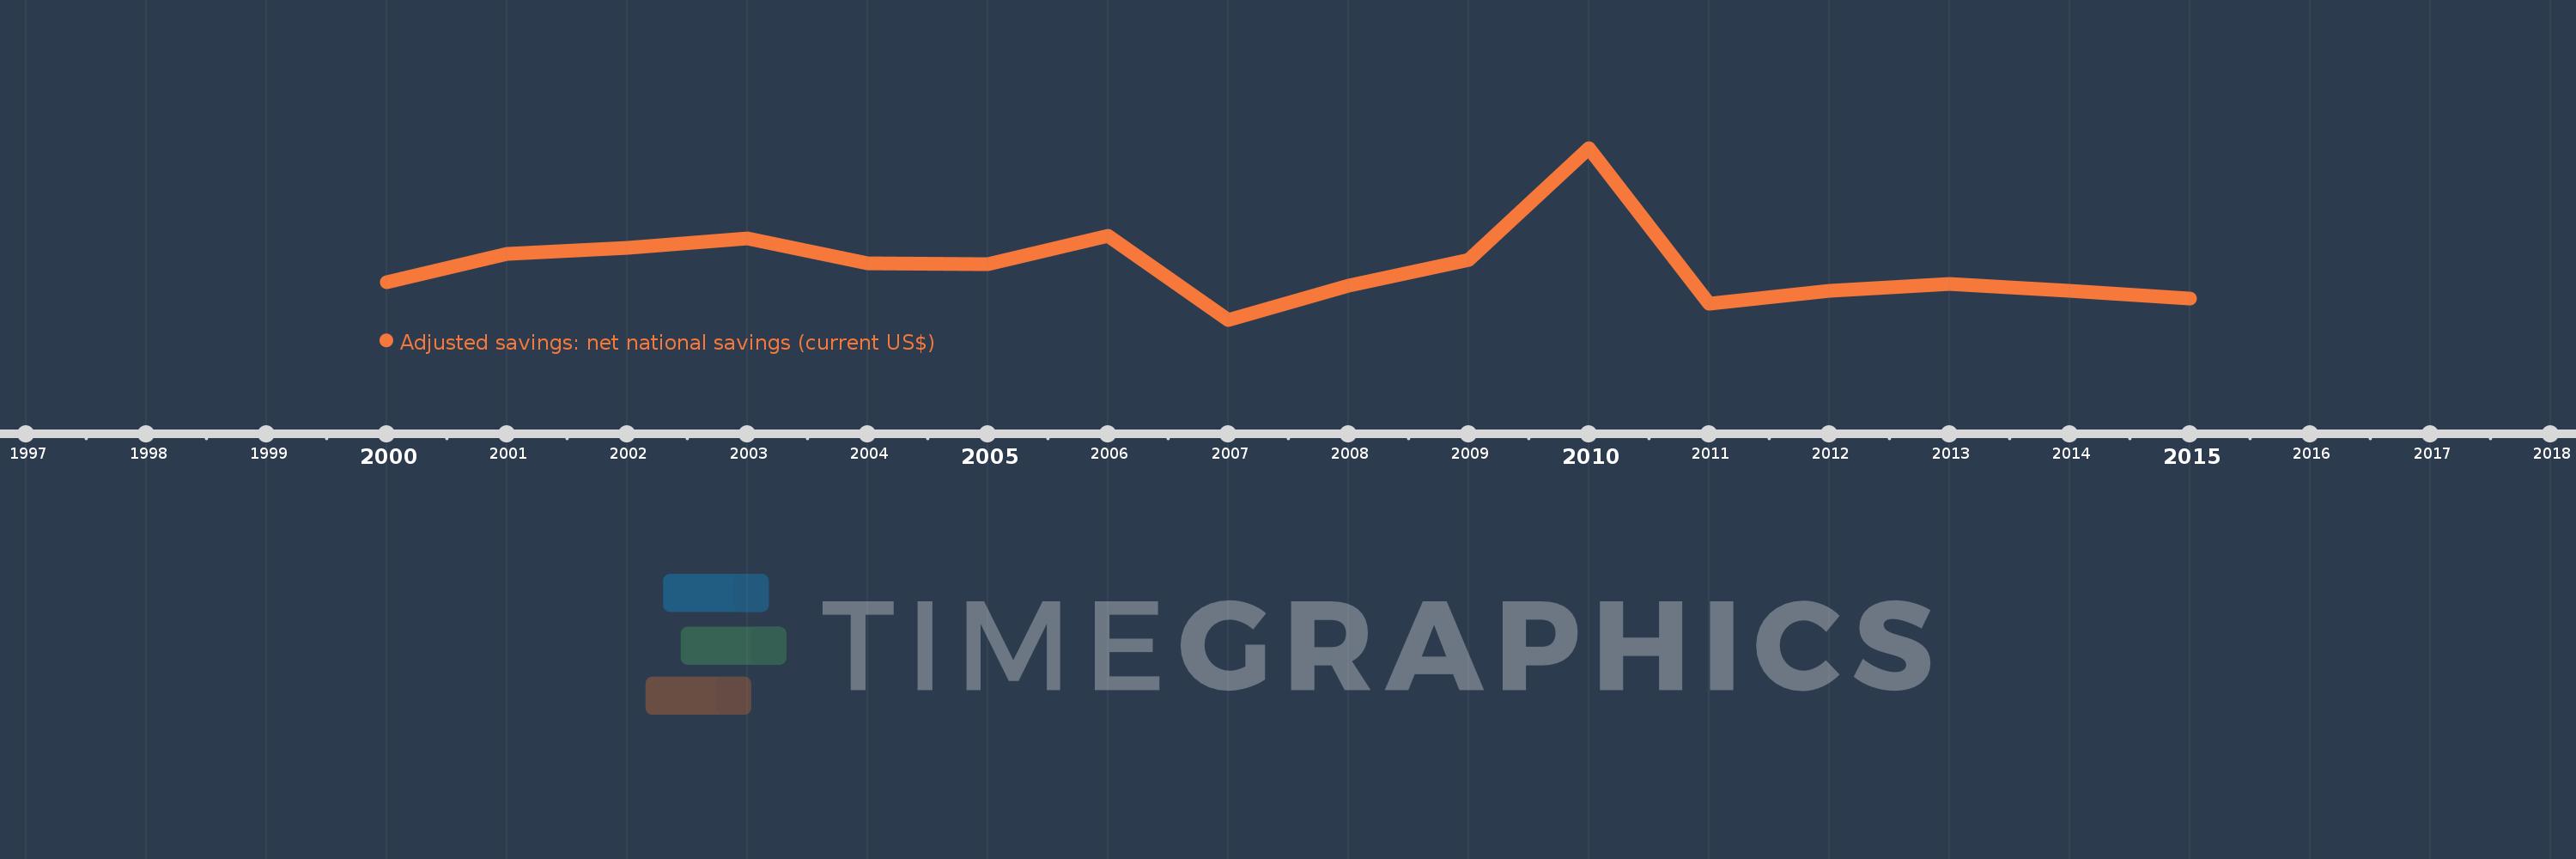
This timeline shows a graph from 2000 to 2015 of Latvia. No data until 1999. Number of actual observations by date: 16.
Source name:
World Development Indicators
Source organization:
World Bank staff estimates based on sources and methods in World Bank's "The Changing Wealth of Nations: Measuring Sustainable Development in the New Millennium" (2011).
Categories, topics:
Economy & Growth, Environment
Last updated:
apr 23, 2017
Indicators value changes by year
Meaning:
-312.316 mln
Minimum:
-1.105 bln
jan 1, 2007
Maximum:
1.46 bln
jan 1, 2010
At the date of observation
Value
Absolute change
Change from the previous value
jan 1, 2000
-544.392 mln
-544.392 mln
0.0%
jan 1, 2001
-120.61 mln
+423.781 mln
-77.84%
jan 1, 2002
-27.994 mln
+92.617 mln
-76.79%
jan 1, 2003
107.5 mln
+135.494 mln
-484.02%
jan 1, 2004
-260.861 mln
-368.361 mln
-342.66%
jan 1, 2005
-274.268 mln
-13.407 mln
5.14%
jan 1, 2006
152.95 mln
+427.218 mln
-155.77%
jan 1, 2007
-1.105 bln
-1.258 bln
-822.25%
jan 1, 2008
-599.083 mln
+505.601 mln
-45.77%
jan 1, 2009
-214.379 mln
+384.704 mln
-64.22%
jan 1, 2010
1.46 bln
+1.674 bln
-780.88%
jan 1, 2011
-867.452 mln
-2.327 bln
-159.43%
jan 1, 2012
-676.571 mln
+190.881 mln
-22.0%
jan 1, 2013
-569.788 mln
+106.782 mln
-15.78%
jan 1, 2014
-668.608 mln
-98.819 mln
17.34%
jan 1, 2015
-788.48 mln
-119.873 mln
17.93%
Ranking of countries by current statistics by years