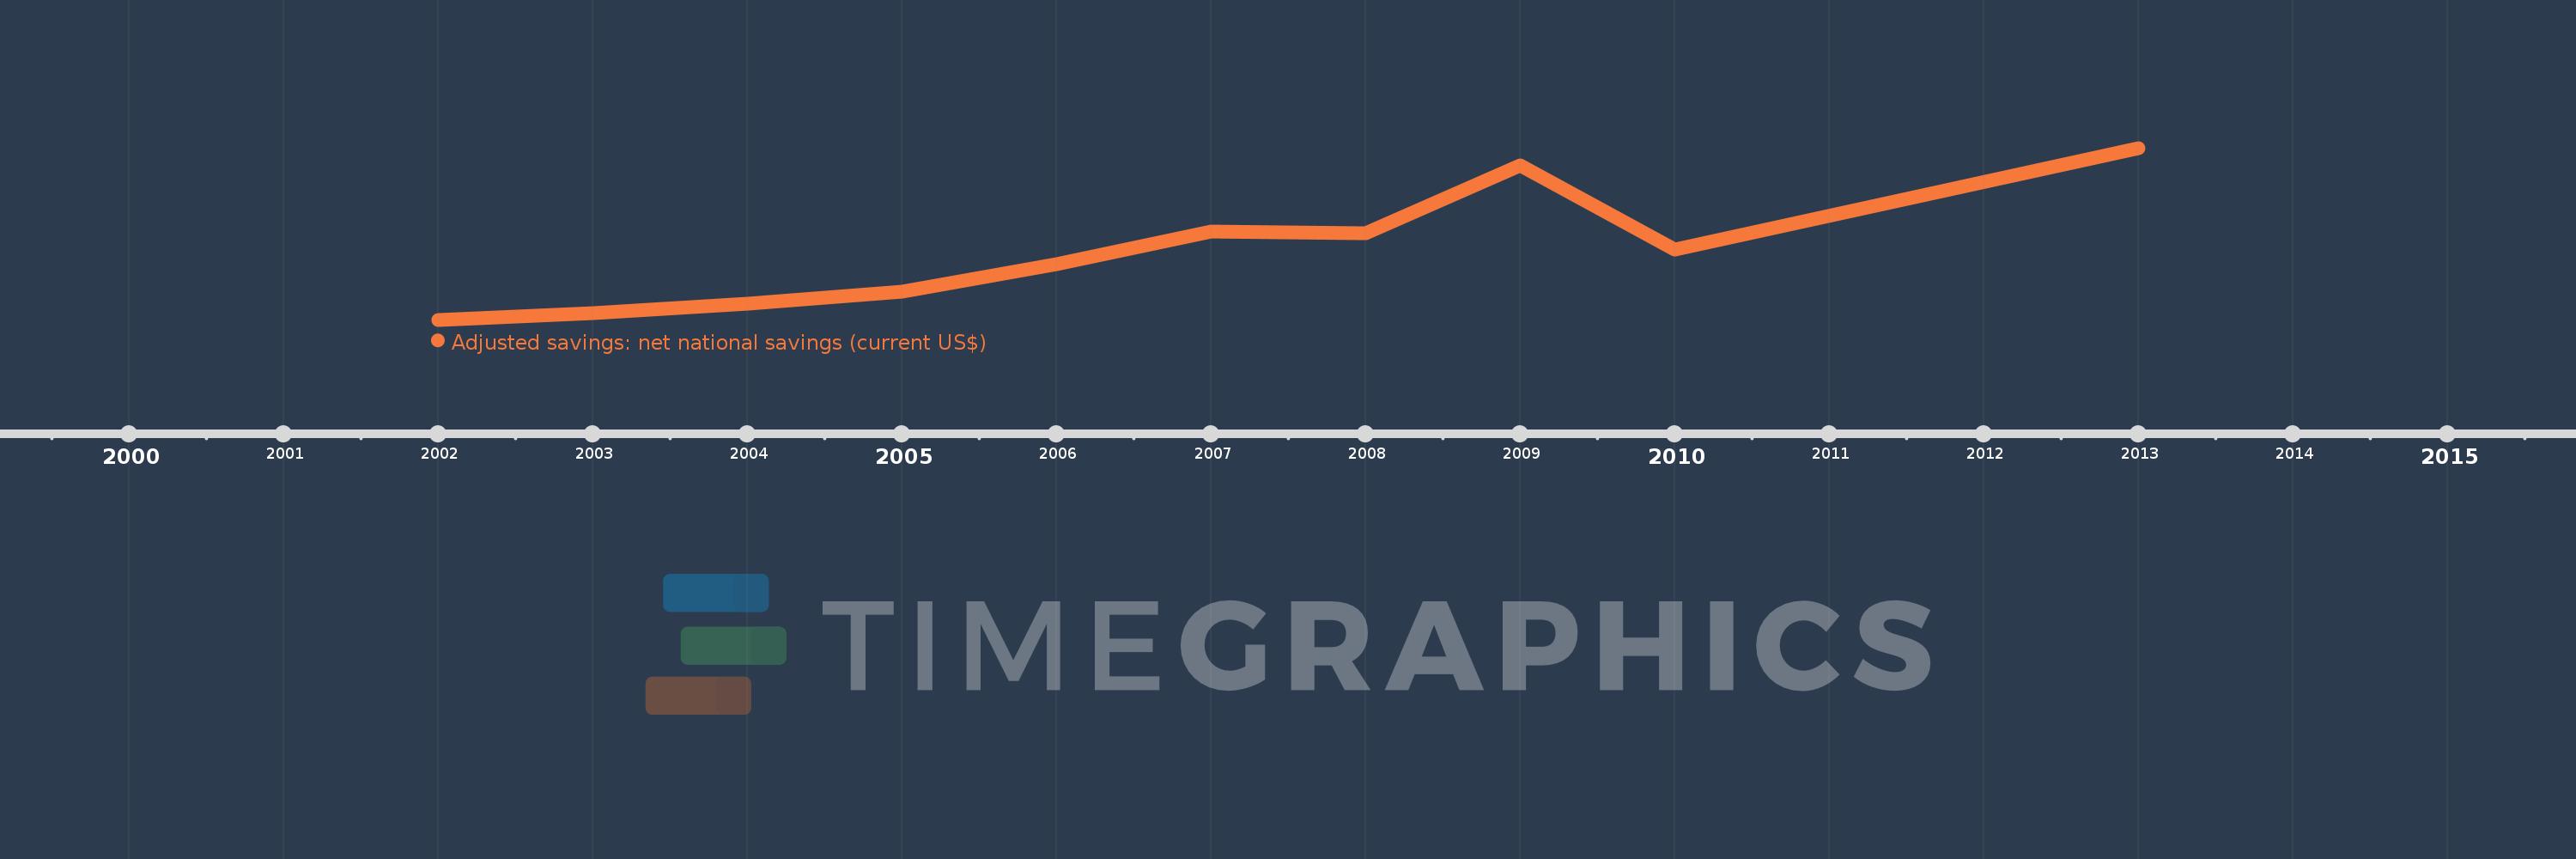
This timeline shows a graph from 2002 to 2013 of Brunei Darussalam. No data until 2001. Number of actual observations by date: 10.
Source name:
World Development Indicators
Source organization:
World Bank staff estimates based on sources and methods in World Bank's "The Changing Wealth of Nations: Measuring Sustainable Development in the New Millennium" (2011).
Categories, topics:
Economy & Growth, Environment
Last updated:
apr 23, 2017
Indicators value changes by year
Meaning:
4.527 bln
Minimum:
1.931 bln
jan 1, 2002
Maximum:
8.51 bln
jan 1, 2013
At the date of observation
Value
Absolute change
Change from the previous value
jan 1, 2002
1.931 bln
+1.931 bln
0.0%
jan 1, 2003
2.182 bln
+250.55 mln
12.97%
jan 1, 2004
2.56 bln
+378.058 mln
17.33%
jan 1, 2005
3.018 bln
+458.594 mln
17.92%
jan 1, 2006
4.076 bln
+1.058 bln
35.04%
jan 1, 2007
5.298 bln
+1.222 bln
29.99%
jan 1, 2008
5.243 bln
-54.984 mln
-1.04%
jan 1, 2009
7.83 bln
+2.587 bln
49.34%
jan 1, 2010
4.619 bln
-3.211 bln
-41.0%
jan 1, 2013
8.51 bln
+3.891 bln
84.24%
Ranking of countries by current statistics by years