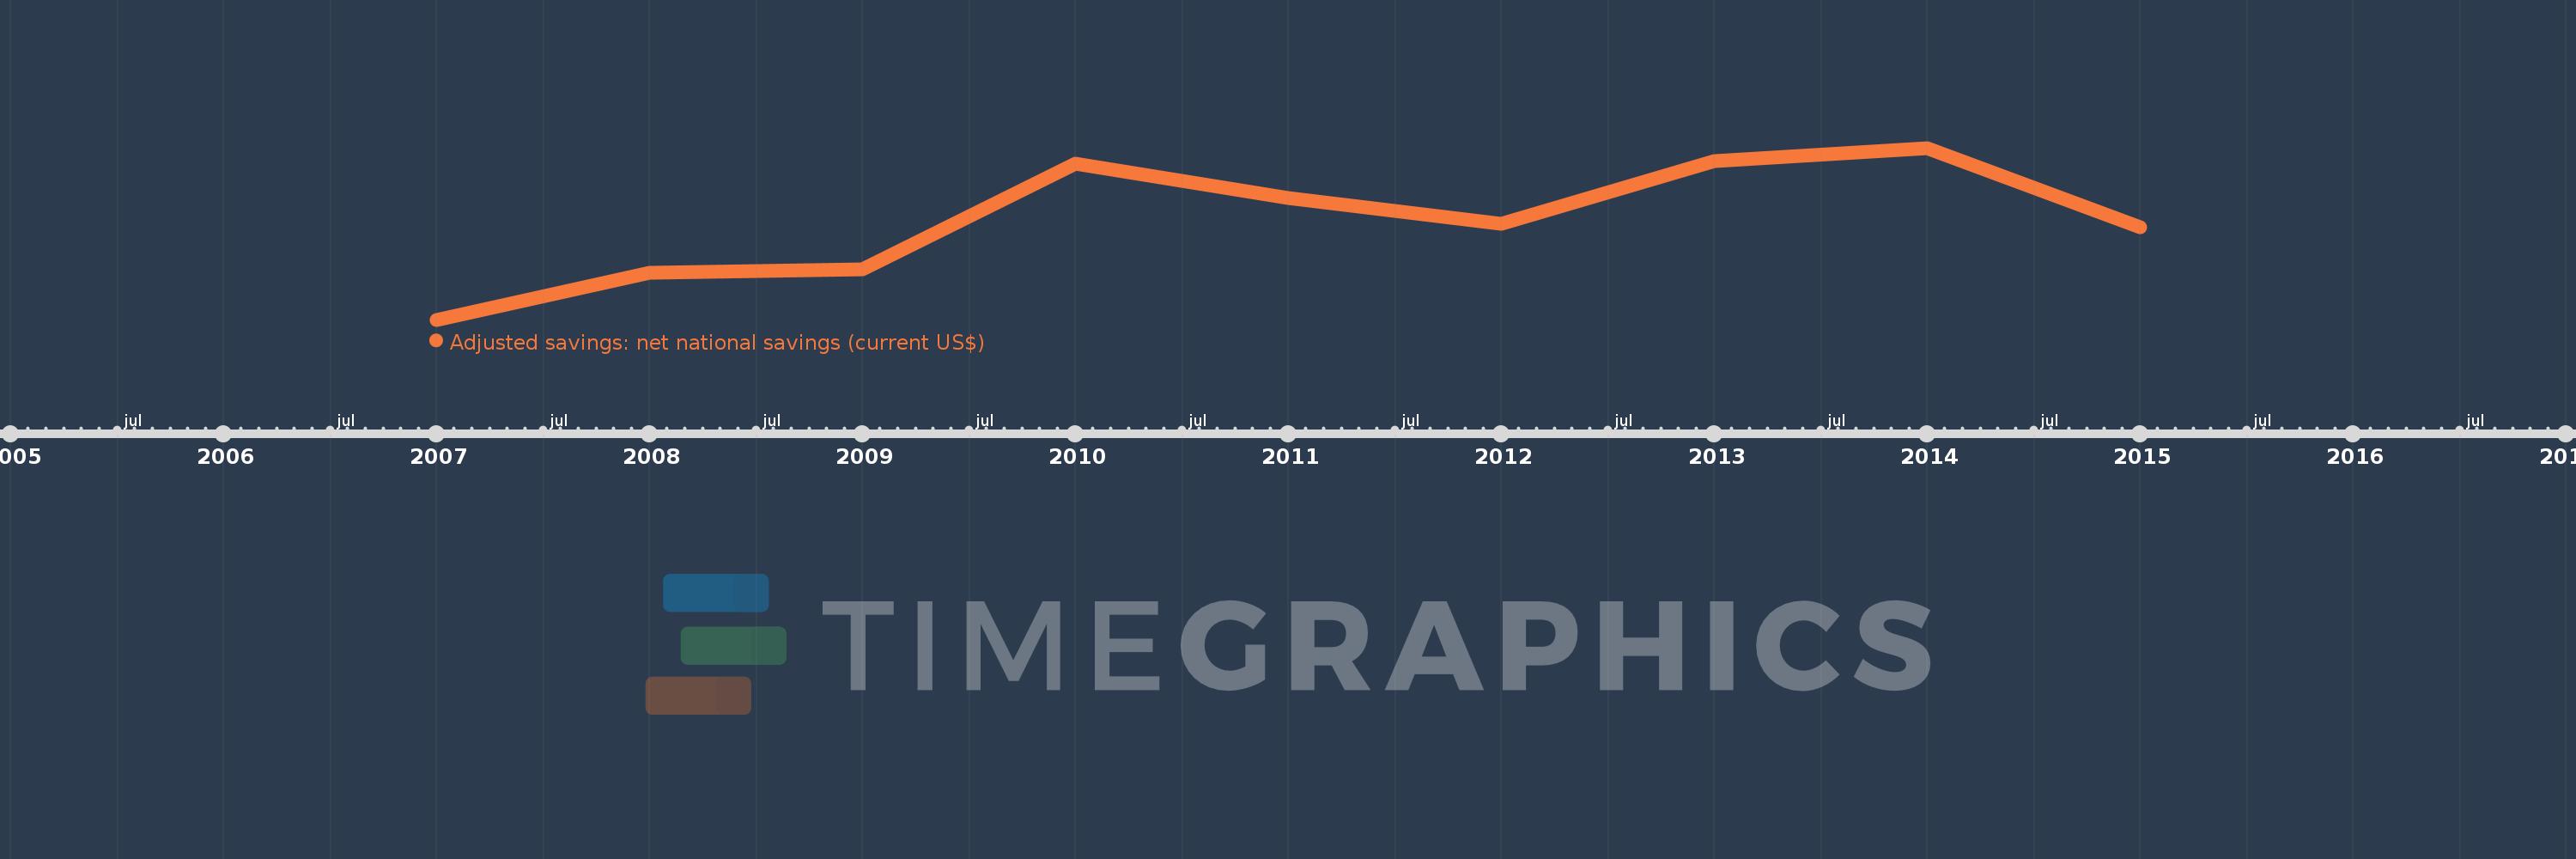
This timeline shows a graph from 2007 to 2015 of Kosovo. No data until 2006. Number of actual observations by date: 9.
Source name:
World Development Indicators
Source organization:
World Bank staff estimates based on sources and methods in World Bank's "The Changing Wealth of Nations: Measuring Sustainable Development in the New Millennium" (2011).
Categories, topics:
Economy & Growth, Environment
Last updated:
apr 23, 2017
Indicators value changes by year
Meaning:
483.783 mln
Minimum:
231.969 mln
jan 1, 2007
Maximum:
667.644 mln
jan 1, 2014
At the date of observation
Value
Absolute change
Change from the previous value
jan 1, 2007
231.969 mln
+231.969 mln
0.0%
jan 1, 2008
350.641 mln
+118.672 mln
51.16%
jan 1, 2009
359.203 mln
+8.563 mln
2.44%
jan 1, 2010
626.734 mln
+267.531 mln
74.48%
jan 1, 2011
539.855 mln
-86.879 mln
-13.86%
jan 1, 2012
475.067 mln
-64.788 mln
-12.0%
jan 1, 2013
635.355 mln
+160.288 mln
33.74%
jan 1, 2014
667.644 mln
+32.288 mln
5.08%
jan 1, 2015
467.582 mln
-200.062 mln
-29.97%
Ranking of countries by current statistics by years