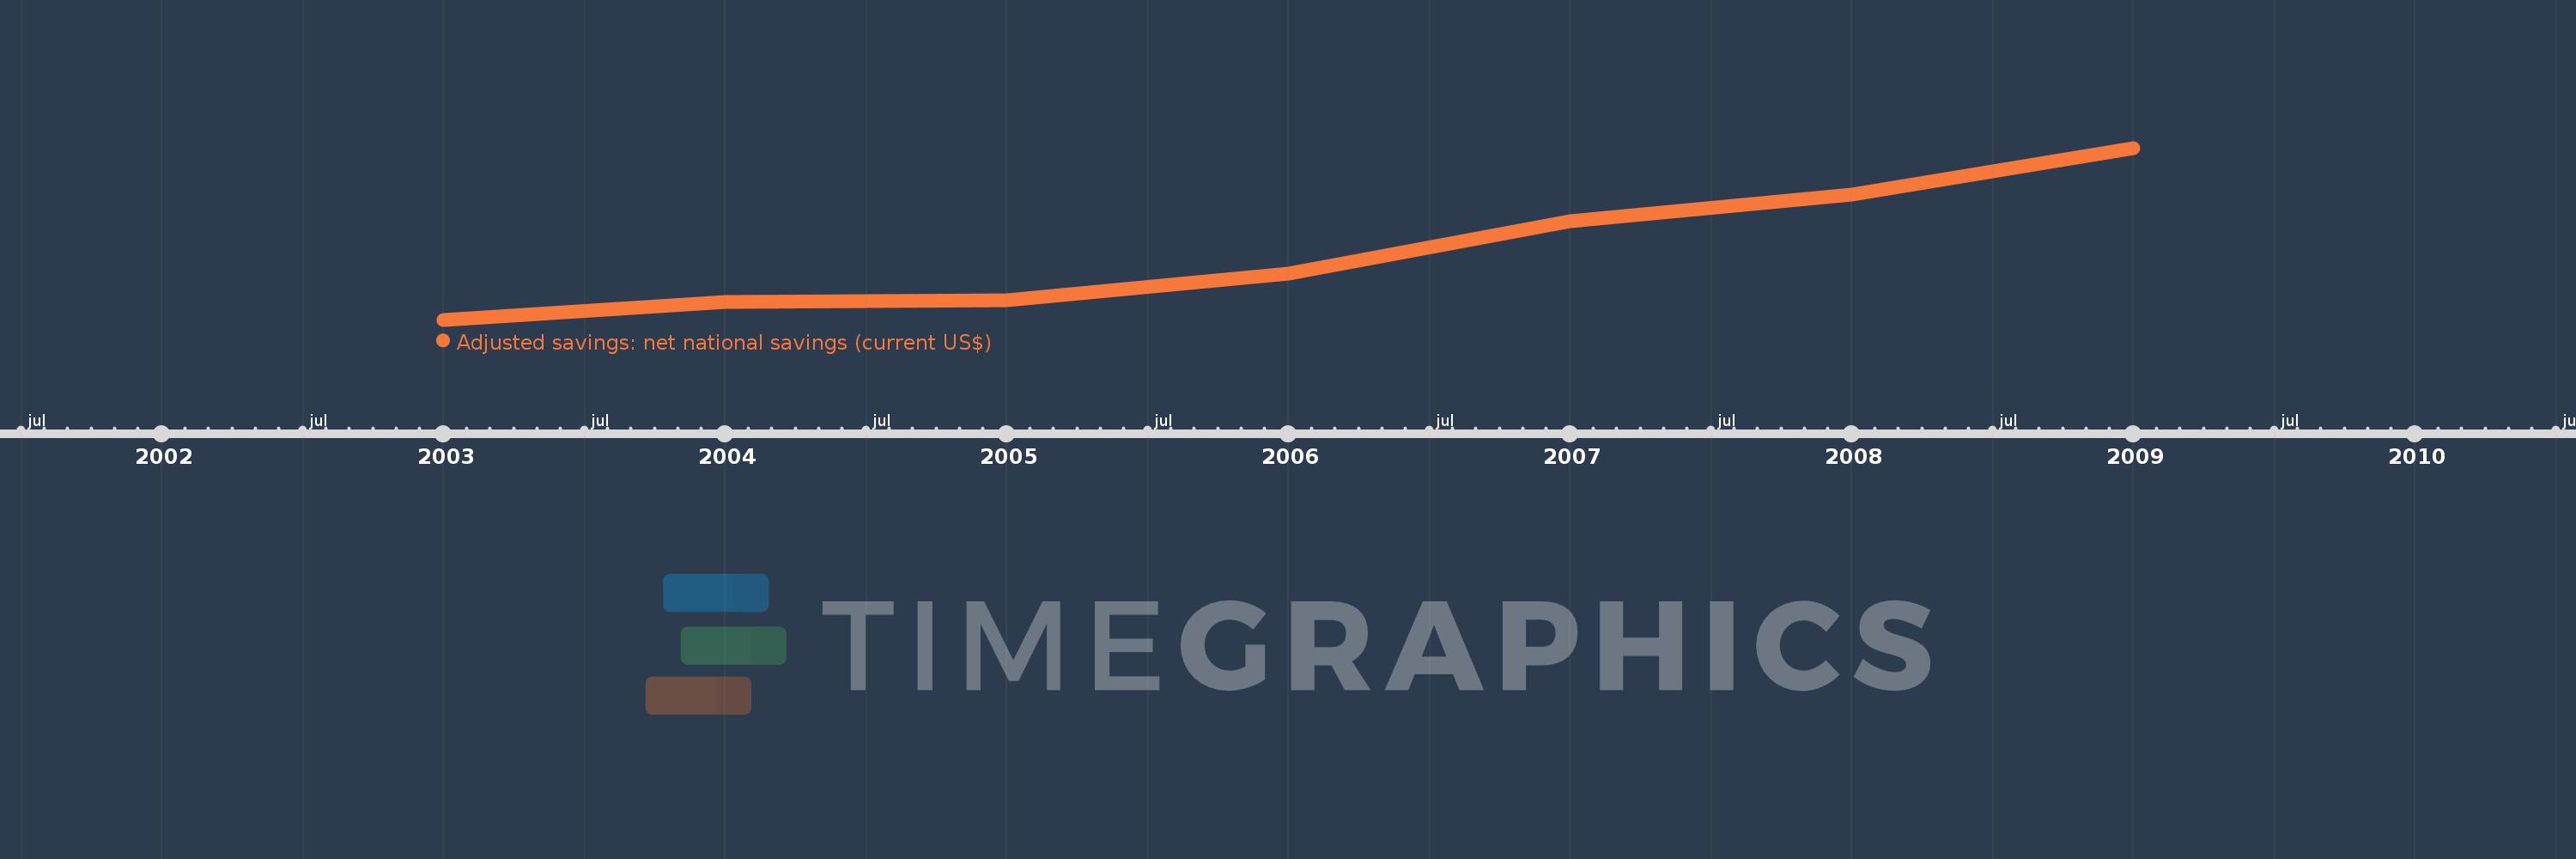
This timeline shows a graph from 2003 to 2009 of Libya. No data until 2002. Number of actual observations by date: 7.
Source name:
World Development Indicators
Source organization:
World Bank staff estimates based on sources and methods in World Bank's "The Changing Wealth of Nations: Measuring Sustainable Development in the New Millennium" (2011).
Categories, topics:
Economy & Growth, Environment
Last updated:
apr 23, 2017
Indicators value changes by year
Meaning:
23.922 bln
Minimum:
2.558 bln
jan 1, 2003
Maximum:
56.237 bln
jan 1, 2009
At the date of observation
Value
Absolute change
Change from the previous value
jan 1, 2003
2.558 bln
+2.558 bln
0.0%
jan 1, 2004
7.985 bln
+5.427 bln
212.17%
jan 1, 2005
8.669 bln
+684.155 mln
8.57%
jan 1, 2006
16.953 bln
+8.284 bln
95.56%
jan 1, 2007
33.383 bln
+16.43 bln
96.92%
jan 1, 2008
41.673 bln
+8.29 bln
24.83%
jan 1, 2009
56.237 bln
+14.564 bln
34.95%
Ranking of countries by current statistics by years