30
/
AIzaSyAYiBZKx7MnpbEhh9jyipgxe19OcubqV5w
April 1, 2024
151318
Hong Kong SAR, China
HKG
true
2
1
Adjusted savings: net national savings (current US$)
2015,2014,2013,2012,2011,2010,2009,2008,2007,2006,2005,2004,2003,2002,2001,2000,1999
Download
Global statistics library →Hong Kong SAR, China →

Adjusted savings: net national savings (current US$)

This statistics in other country:

AfghanistanAlbaniaAlgeriaAngolaAntigua and BarbudaArgentinaArmeniaAustraliaAustriaAzerbaijanBahamas, TheBahrainBangladeshBarbadosBelarusBelgiumBelizeBeninBermudaBhutanBoliviaBosnia and HerzegovinaBotswanaBrazilBrunei DarussalamBulgariaBurkina FasoBurundiCabo VerdeCambodiaCameroonCanadaCentral African RepublicChadChileChinaColombiaComorosCongo, Dem. Rep.Congo, Rep.Costa RicaCote d'IvoireCroatiaCyprusCzech RepublicDenmarkDjiboutiDominicaDominican RepublicEcuadorEgypt, Arab Rep.El SalvadorEquatorial GuineaEritreaEstoniaEthiopiaFijiFinlandFranceGabonGambia, TheGeorgiaGermanyGhanaGreeceGrenadaGuatemalaGuineaGuinea-BissauGuyanaHaitiHondurasHong Kong SAR, ChinaHungaryIcelandIndiaIndonesiaIran, Islamic Rep.IraqIrelandIsraelItalyJamaicaJapanJordanKazakhstanKenyaKiribatiKorea, Rep.KosovoKuwaitKyrgyz RepublicLao PDRLatviaLebanonLesothoLiberiaLibyaLithuaniaLuxembourgMacao SAR, ChinaMacedonia, FYRMadagascarMalawiMalaysiaMaldivesMaliMaltaMauritaniaMauritiusMexicoMoldovaMongoliaMontenegroMoroccoMozambiqueNamibiaNepalNetherlandsNew ZealandNicaraguaNigerNigeriaNorwayOmanPakistanPanamaPapua New GuineaParaguayPeruPhilippinesPolandPortugalQatarRomaniaRussian FederationRwandaSaudi ArabiaSenegalSerbiaSeychellesSierra LeoneSingaporeSlovak RepublicSloveniaSolomon IslandsSouth AfricaSpainSri LankaSt. Kitts and NevisSt. LuciaSt. Vincent and the GrenadinesSudanSurinameSwazilandSwedenSwitzerlandSyrian Arab RepublicTajikistanTanzaniaThailandTimor-LesteTogoTongaTrinidad and TobagoTunisiaTurkeyTurkmenistanUgandaUkraineUnited KingdomUnited StatesUruguayVanuatuVenezuela, RBVietnamWest Bank and GazaYemen, Rep.ZambiaZimbabwe

Timeline:

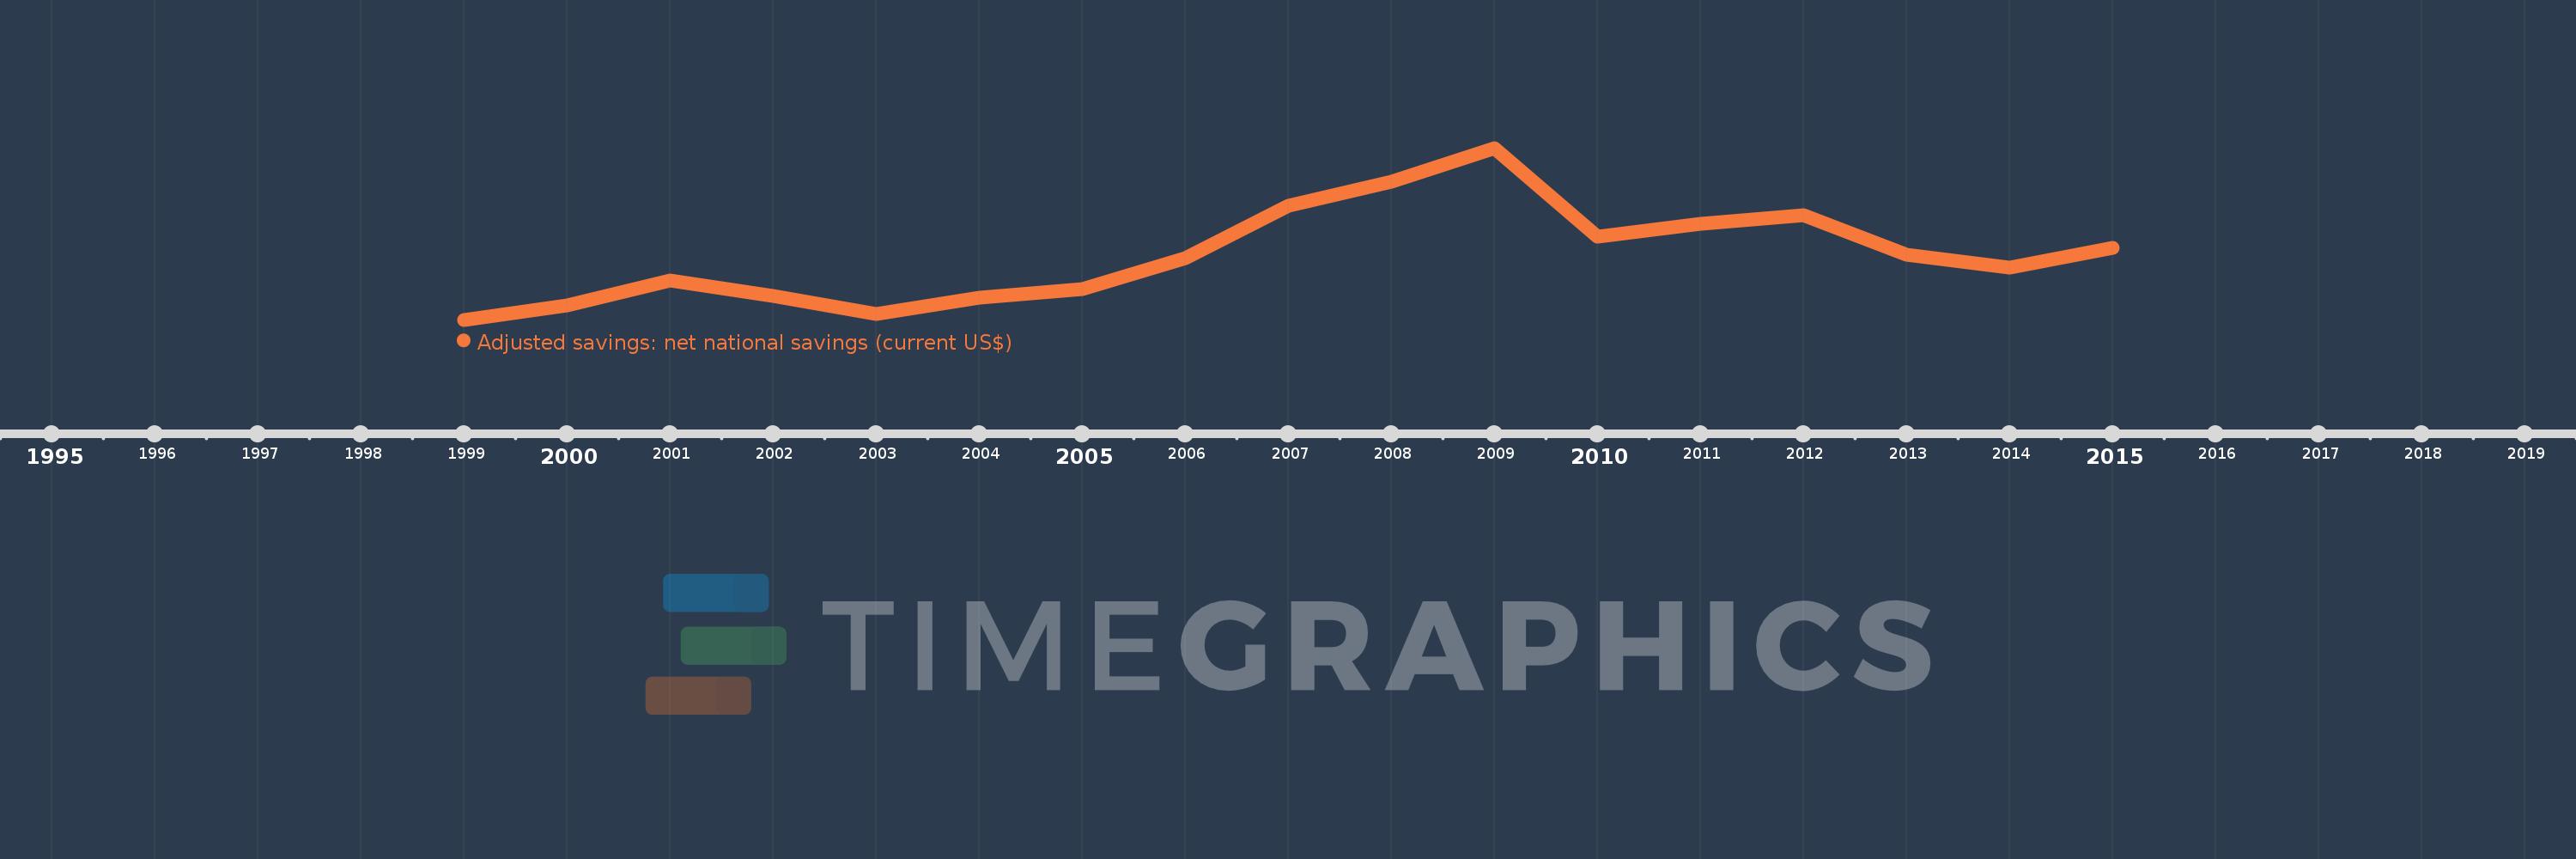
This timeline shows a graph from 1999 to 2015 of Hong Kong SAR, China. No data until 1998. Number of actual observations by date: 17.

Source name:

World Development Indicators

Source organization:

World Bank staff estimates based on sources and methods in World Bank's "The Changing Wealth of Nations: Measuring Sustainable Development in the New Millennium" (2011).

Categories, topics:

Economy & Growth, Environment

Last updated:

apr 23, 2017

Indicators value changes by year

Meaning:
38.839 bln
Minimum:
29.992 bln
jan 1, 1999
Maximum:
53.626 bln
jan 1, 2009
At the date of observation
Value
Absolute change
Change from the previous value
jan 1, 1999
29.992 bln
+29.992 bln
0.0%
jan 1, 2000
31.952 bln
+1.959 bln
6.53%
jan 1, 2001
35.376 bln
+3.425 bln
10.72%
jan 1, 2002
33.239 bln
-2.138 bln
-6.04%
jan 1, 2003
30.762 bln
-2.477 bln
-7.45%
jan 1, 2004
33.065 bln
+2.303 bln
7.49%
jan 1, 2005
34.157 bln
+1.092 bln
3.3%
jan 1, 2006
38.451 bln
+4.294 bln
12.57%
jan 1, 2007
45.688 bln
+7.236 bln
18.82%
jan 1, 2008
48.977 bln
+3.289 bln
7.2%
jan 1, 2009
53.626 bln
+4.65 bln
9.49%
jan 1, 2010
41.421 bln
-12.205 bln
-22.76%
jan 1, 2011
43.246 bln
+1.825 bln
4.41%
jan 1, 2012
44.335 bln
+1.089 bln
2.52%
jan 1, 2013
38.973 bln
-5.362 bln
-12.09%
jan 1, 2014
37.12 bln
-1.853 bln
-4.75%
jan 1, 2015
39.882 bln
+2.762 bln
7.44%

Ranking of countries by current statistics by years