29
/
en
AIzaSyAYiBZKx7MnpbEhh9jyipgxe19OcubqV5w
April 1, 2024
283365
West Bank and Gaza
PSE
true
2
1
Adjusted savings: net national savings (current US$)
2015,2014,2013,2012,2011,2010,2009,2008,2007,2006,2005,2004,2003,2002,2001,2000,1999,1998,1997,1996
Download
Global statistics library →West Bank and Gaza →

Adjusted savings: net national savings (current US$)

This statistics in other country:
AfghanistanAlbaniaAlgeriaAngolaAntigua and BarbudaArgentinaArmeniaAustraliaAustriaAzerbaijanBahamas, TheBahrainBangladeshBarbadosBelarusBelgiumBelizeBeninBermudaBhutanBoliviaBosnia and HerzegovinaBotswanaBrazilBrunei DarussalamBulgariaBurkina FasoBurundiCabo VerdeCambodiaCameroonCanadaCentral African RepublicChadChileChinaColombiaComorosCongo, Dem. Rep.Congo, Rep.Costa RicaCote d'IvoireCroatiaCyprusCzech RepublicDenmarkDjiboutiDominicaDominican RepublicEcuadorEgypt, Arab Rep.El SalvadorEquatorial GuineaEritreaEstoniaEthiopiaFijiFinlandFranceGabonGambia, TheGeorgiaGermanyGhanaGreeceGrenadaGuatemalaGuineaGuinea-BissauGuyanaHaitiHondurasHong Kong SAR, ChinaHungaryIcelandIndiaIndonesiaIran, Islamic Rep.IraqIrelandIsraelItalyJamaicaJapanJordanKazakhstanKenyaKiribatiKorea, Rep.KosovoKuwaitKyrgyz RepublicLao PDRLatviaLebanonLesothoLiberiaLibyaLithuaniaLuxembourgMacao SAR, ChinaMacedonia, FYRMadagascarMalawiMalaysiaMaldivesMaliMaltaMauritaniaMauritiusMexicoMoldovaMongoliaMontenegroMoroccoMozambiqueNamibiaNepalNetherlandsNew ZealandNicaraguaNigerNigeriaNorwayOmanPakistanPanamaPapua New GuineaParaguayPeruPhilippinesPolandPortugalQatarRomaniaRussian FederationRwandaSaudi ArabiaSenegalSerbiaSeychellesSierra LeoneSingaporeSlovak RepublicSloveniaSolomon IslandsSouth AfricaSpainSri LankaSt. Kitts and NevisSt. LuciaSt. Vincent and the GrenadinesSudanSurinameSwazilandSwedenSwitzerlandSyrian Arab RepublicTajikistanTanzaniaThailandTimor-LesteTogoTongaTrinidad and TobagoTunisiaTurkeyTurkmenistanUgandaUkraineUnited KingdomUnited StatesUruguayVanuatuVenezuela, RBVietnamWest Bank and GazaYemen, Rep.ZambiaZimbabwe
Timeline:
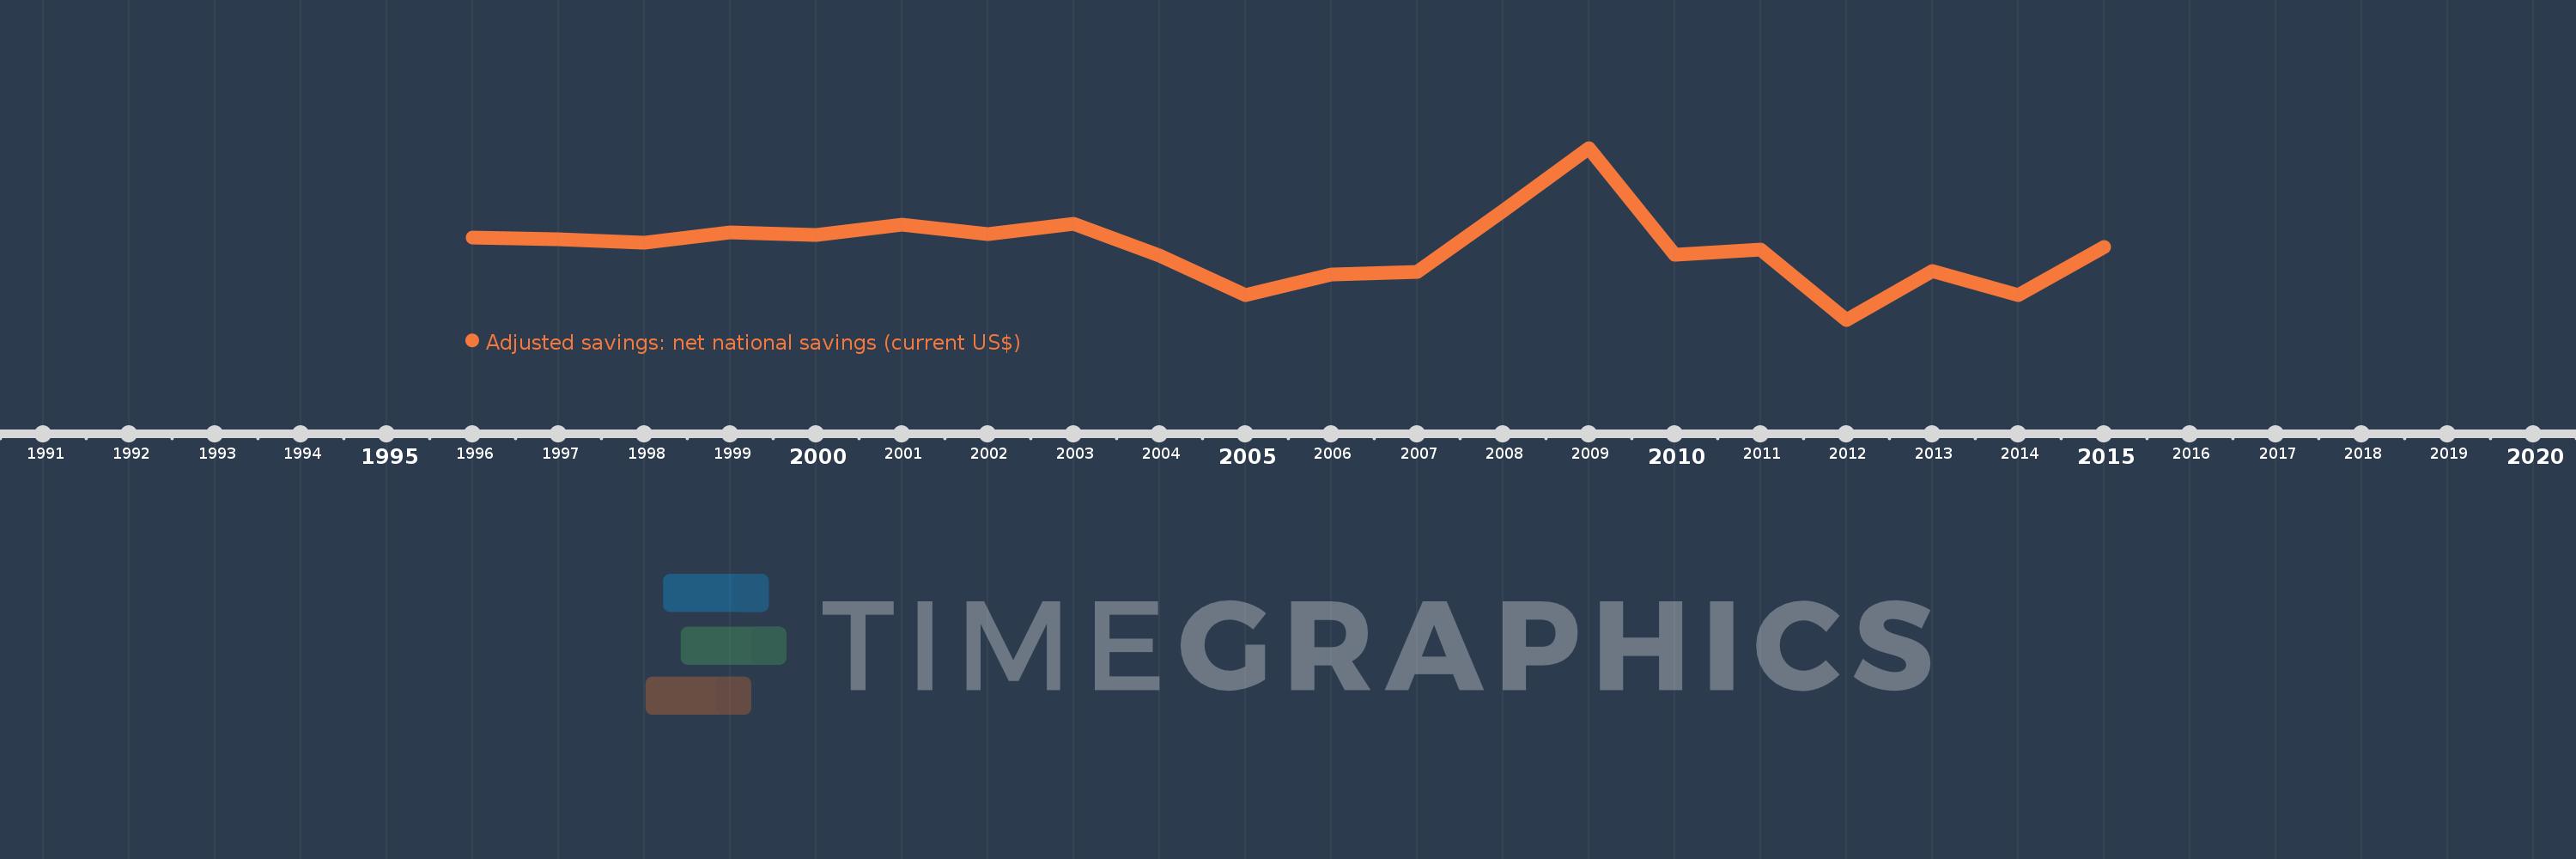
This timeline shows a graph from 1996 to 2015 of West Bank and Gaza. No data until 1995. Number of actual observations by date: 20.
Source name:
World Development Indicators
Source organization:
World Bank staff estimates based on sources and methods in World Bank's "The Changing Wealth of Nations: Measuring Sustainable Development in the New Millennium" (2011).
Categories, topics:
Economy & Growth, Environment
Last updated:
apr 23, 2017
Indicators value changes by year
Mean:
-159.593 mln
Minimum:
-1.126 bln
jan 1, 2012
Maximum:
1.192 bln
jan 1, 2009
At the date of observation
Value
Absolute change
Change from previous value
jan 1, 1996
-16.326 mln
-16.326 mln
0.0%
jan 1, 1997
-39.246 mln
-22.92 mln
140.39%
jan 1, 1998
-83.72 mln
-44.474 mln
113.32%
jan 1, 1999
47.712 mln
+131.432 mln
-156.99%
jan 1, 2000
12.475 mln
-35.237 mln
-73.85%
jan 1, 2001
161.4 mln
+148.925 mln
1.19K%
jan 1, 2002
30.329 mln
-131.07 mln
-81.21%
jan 1, 2003
166.985 mln
+136.655 mln
450.57%
jan 1, 2004
-254.885 mln
-421.87 mln
-252.64%
jan 1, 2005
-793.53 mln
-538.645 mln
211.33%
jan 1, 2006
-516.55 mln
+276.98 mln
-34.9%
jan 1, 2007
-478.838 mln
+37.712 mln
-7.3%
jan 1, 2008
337.658 mln
+816.496 mln
-170.52%
jan 1, 2009
1.192 bln
+853.876 mln
252.88%
jan 1, 2010
-245.466 mln
-1.437 bln
-120.6%
jan 1, 2011
-178.05 mln
+67.416 mln
-27.46%
jan 1, 2012
-1.126 bln
-948.322 mln
532.62%
jan 1, 2013
-473.06 mln
+653.312 mln
-58.0%
jan 1, 2014
-792.618 mln
-319.558 mln
67.55%
jan 1, 2015
-141.29 mln
+651.329 mln
-82.17%
Ranking of countries by current statistics by years

Comments:

Send
PremiumAbout & FeedbackTermsPrivacy
logo
© 2022 Selected Technologies LLC – Morgan Hill, California