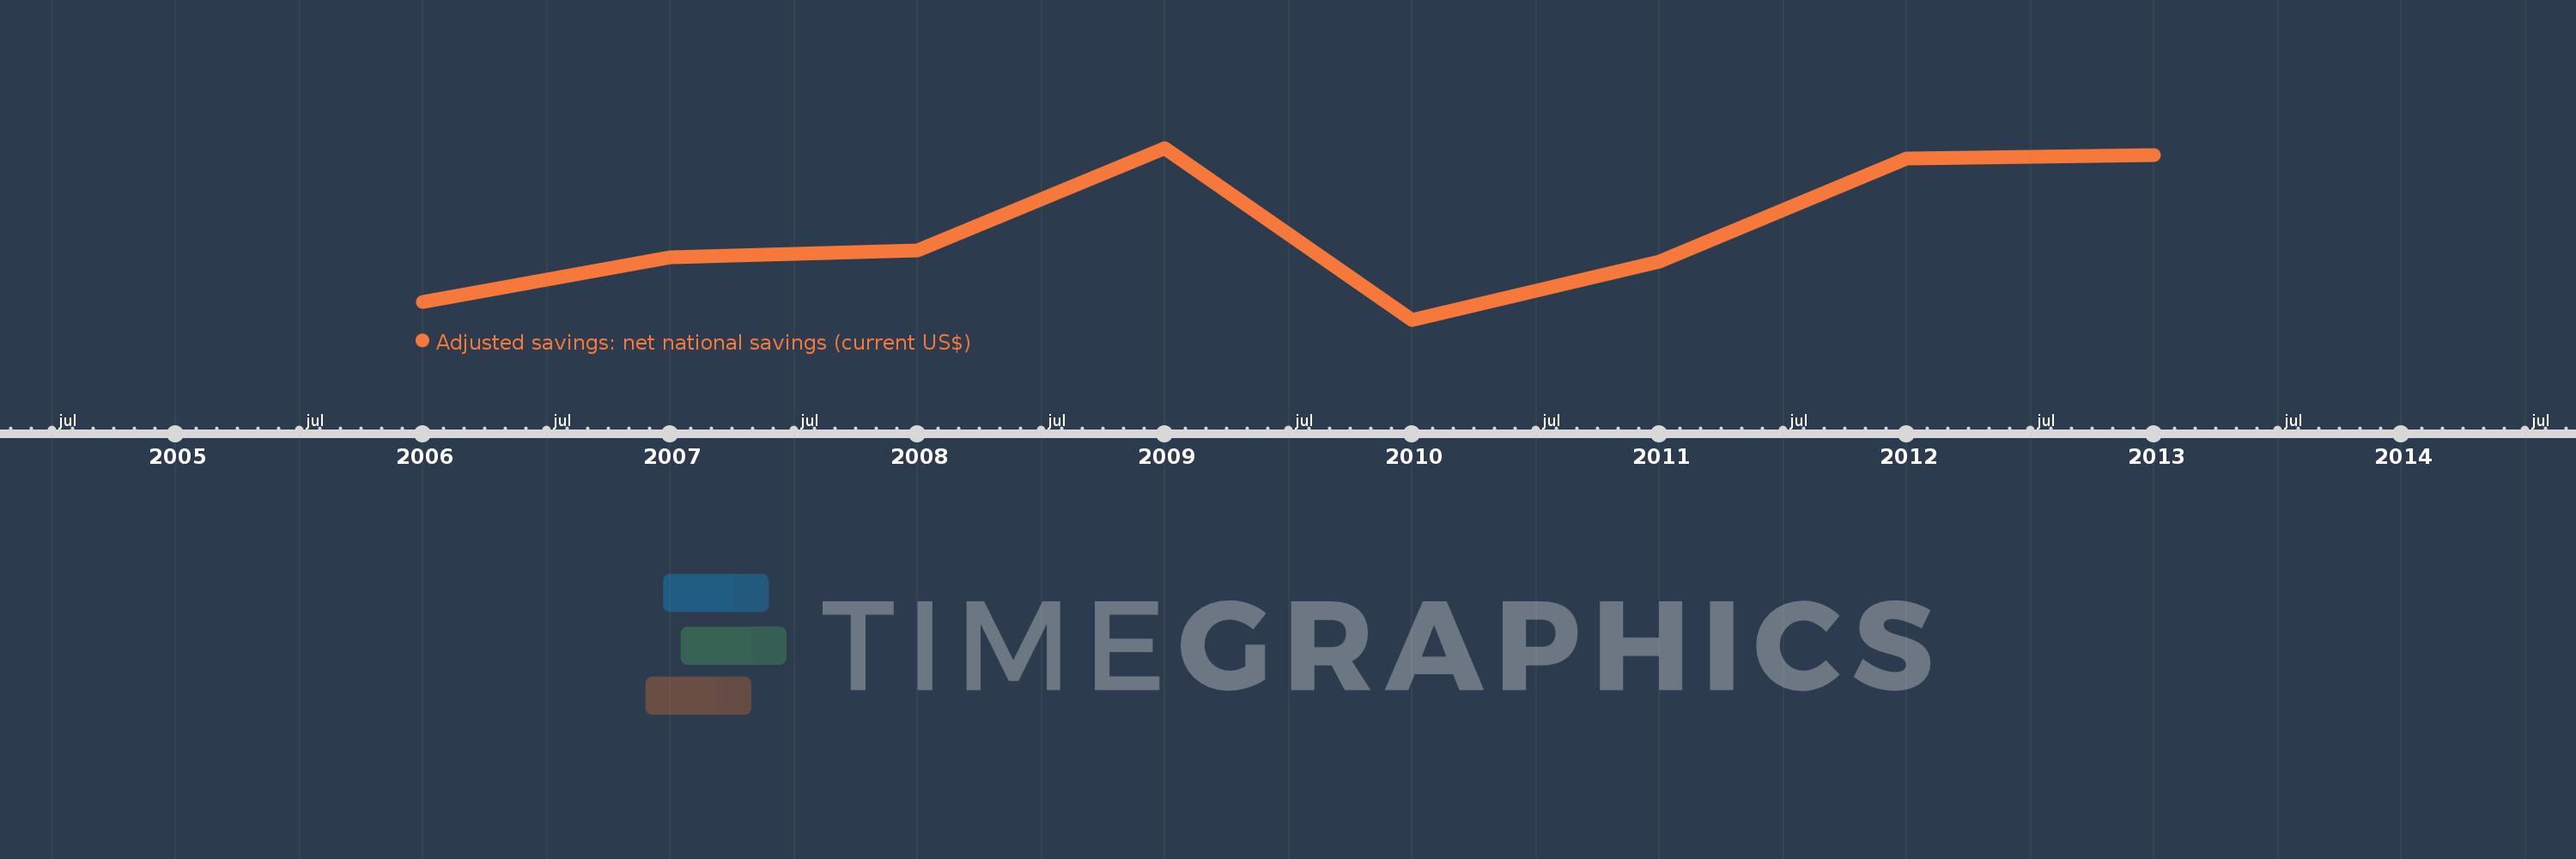
This timeline shows a graph from 2006 to 2013 of Iraq. No data until 2005. Number of actual observations by date: 8.
Source name:
World Development Indicators
Source organization:
World Bank staff estimates based on sources and methods in World Bank's "The Changing Wealth of Nations: Measuring Sustainable Development in the New Millennium" (2011).
Categories, topics:
Economy & Growth, Environment
Last updated:
apr 23, 2017
Indicators value changes by year
Meaning:
16.327 bln
Minimum:
-45.556 mln
jan 1, 2010
Maximum:
31.862 bln
jan 1, 2009
At the date of observation
Value
Absolute change
Change from the previous value
jan 1, 2006
3.272 bln
+3.272 bln
0.0%
jan 1, 2007
11.537 bln
+8.265 bln
252.57%
jan 1, 2008
12.765 bln
+1.228 bln
10.65%
jan 1, 2009
31.862 bln
+19.097 bln
149.6%
jan 1, 2010
-45.556 mln
-31.908 bln
-100.14%
jan 1, 2011
10.761 bln
+10.807 bln
-23.72K%
jan 1, 2012
29.941 bln
+19.18 bln
178.23%
jan 1, 2013
30.522 bln
+581.35 mln
1.94%
Ranking of countries by current statistics by years