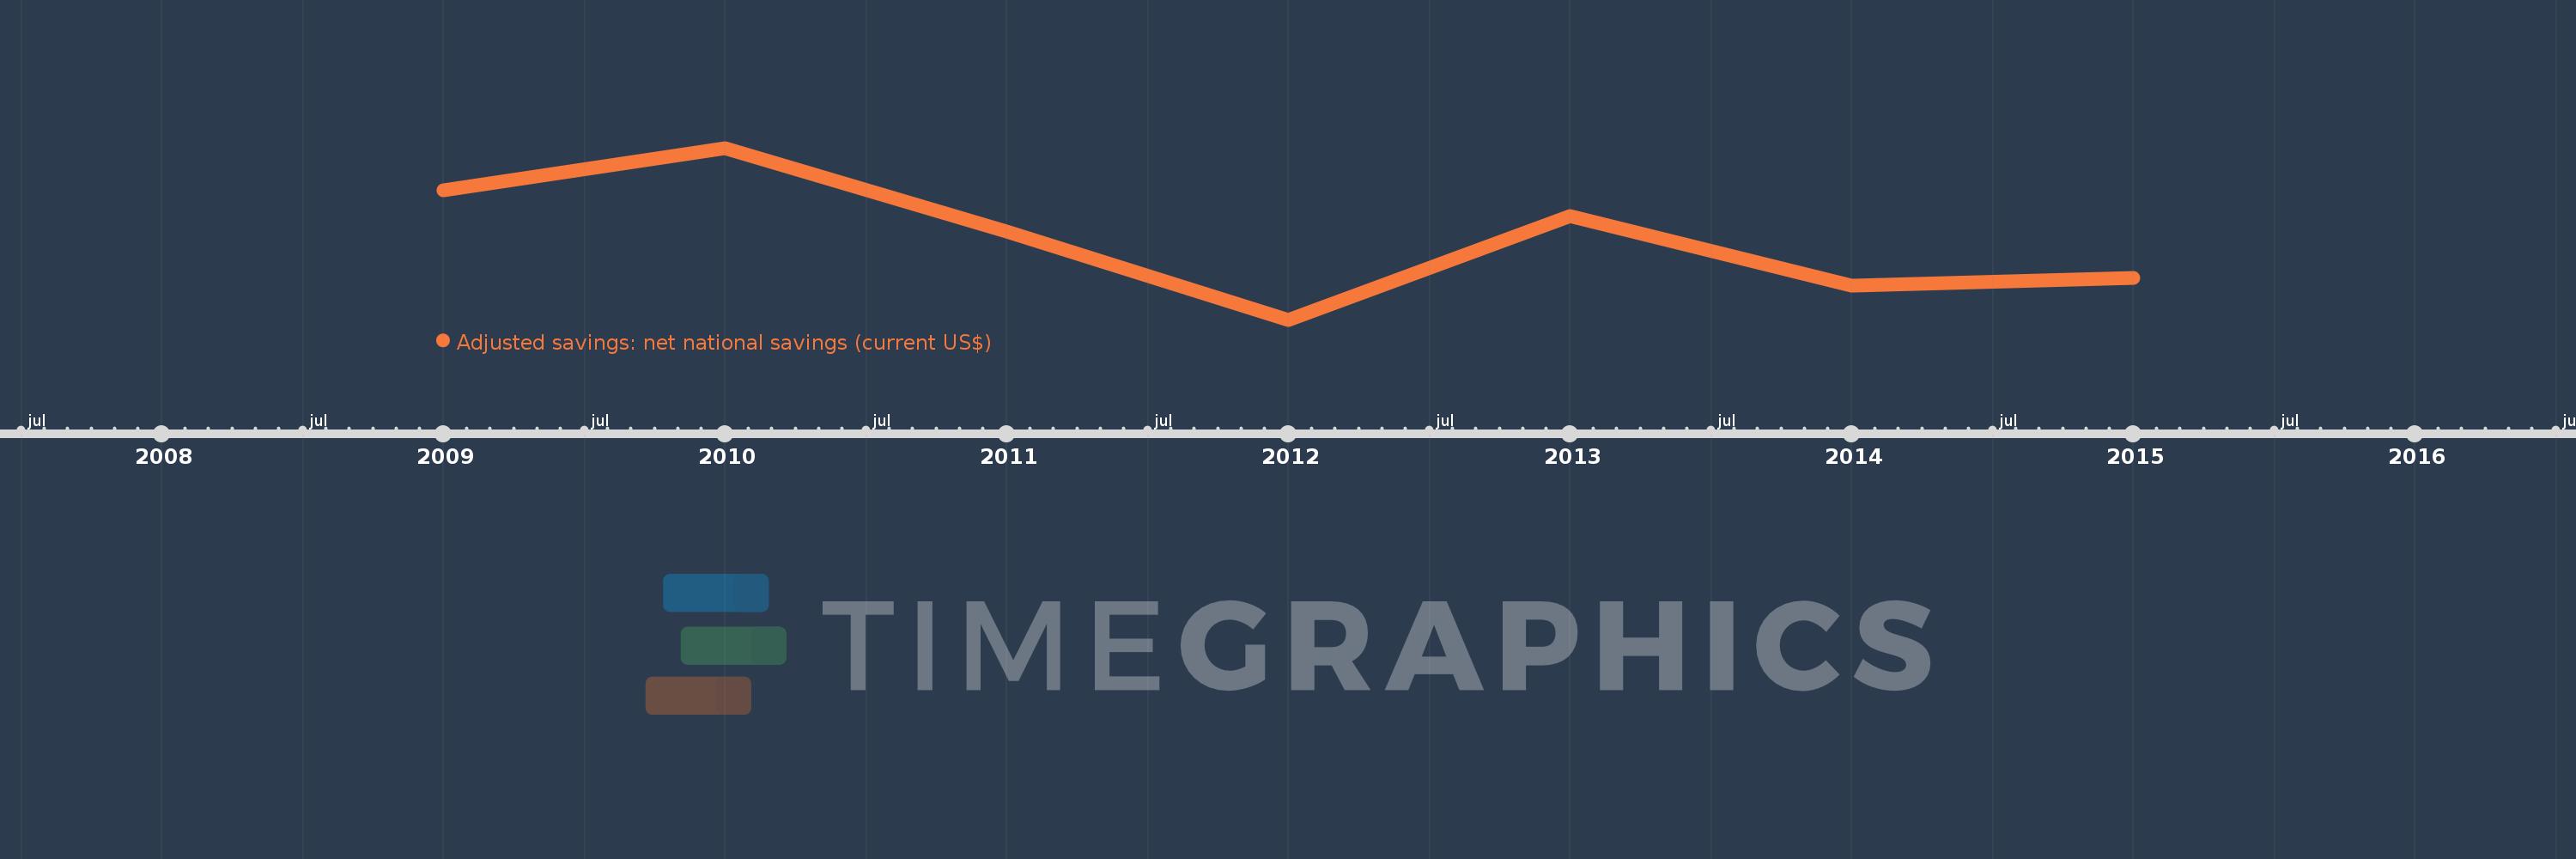
This timeline shows a graph from 2009 to 2015 of Afghanistan. No data until 2008. Number of actual observations by date: 7.
Source name:
World Development Indicators
Source organization:
World Bank staff estimates based on sources and methods in World Bank's "The Changing Wealth of Nations: Measuring Sustainable Development in the New Millennium" (2011).
Categories, topics:
Economy & Growth, Environment
Last updated:
apr 23, 2017
Indicators value changes by year
Meaning:
-2.409 bln
Minimum:
-3.7 bln
jan 1, 2012
Maximum:
-972.176 mln
jan 1, 2010
At the date of observation
Value
Absolute change
Change from the previous value
jan 1, 2009
-1.641 bln
-1.641 bln
0.0%
jan 1, 2010
-972.176 mln
+668.989 mln
-40.76%
jan 1, 2011
-2.296 bln
-1.323 bln
136.13%
jan 1, 2012
-3.7 bln
-1.404 bln
61.16%
jan 1, 2013
-2.048 bln
+1.651 bln
-44.64%
jan 1, 2014
-3.161 bln
-1.113 bln
54.35%
jan 1, 2015
-3.042 bln
+119.372 mln
-3.78%
Ranking of countries by current statistics by years