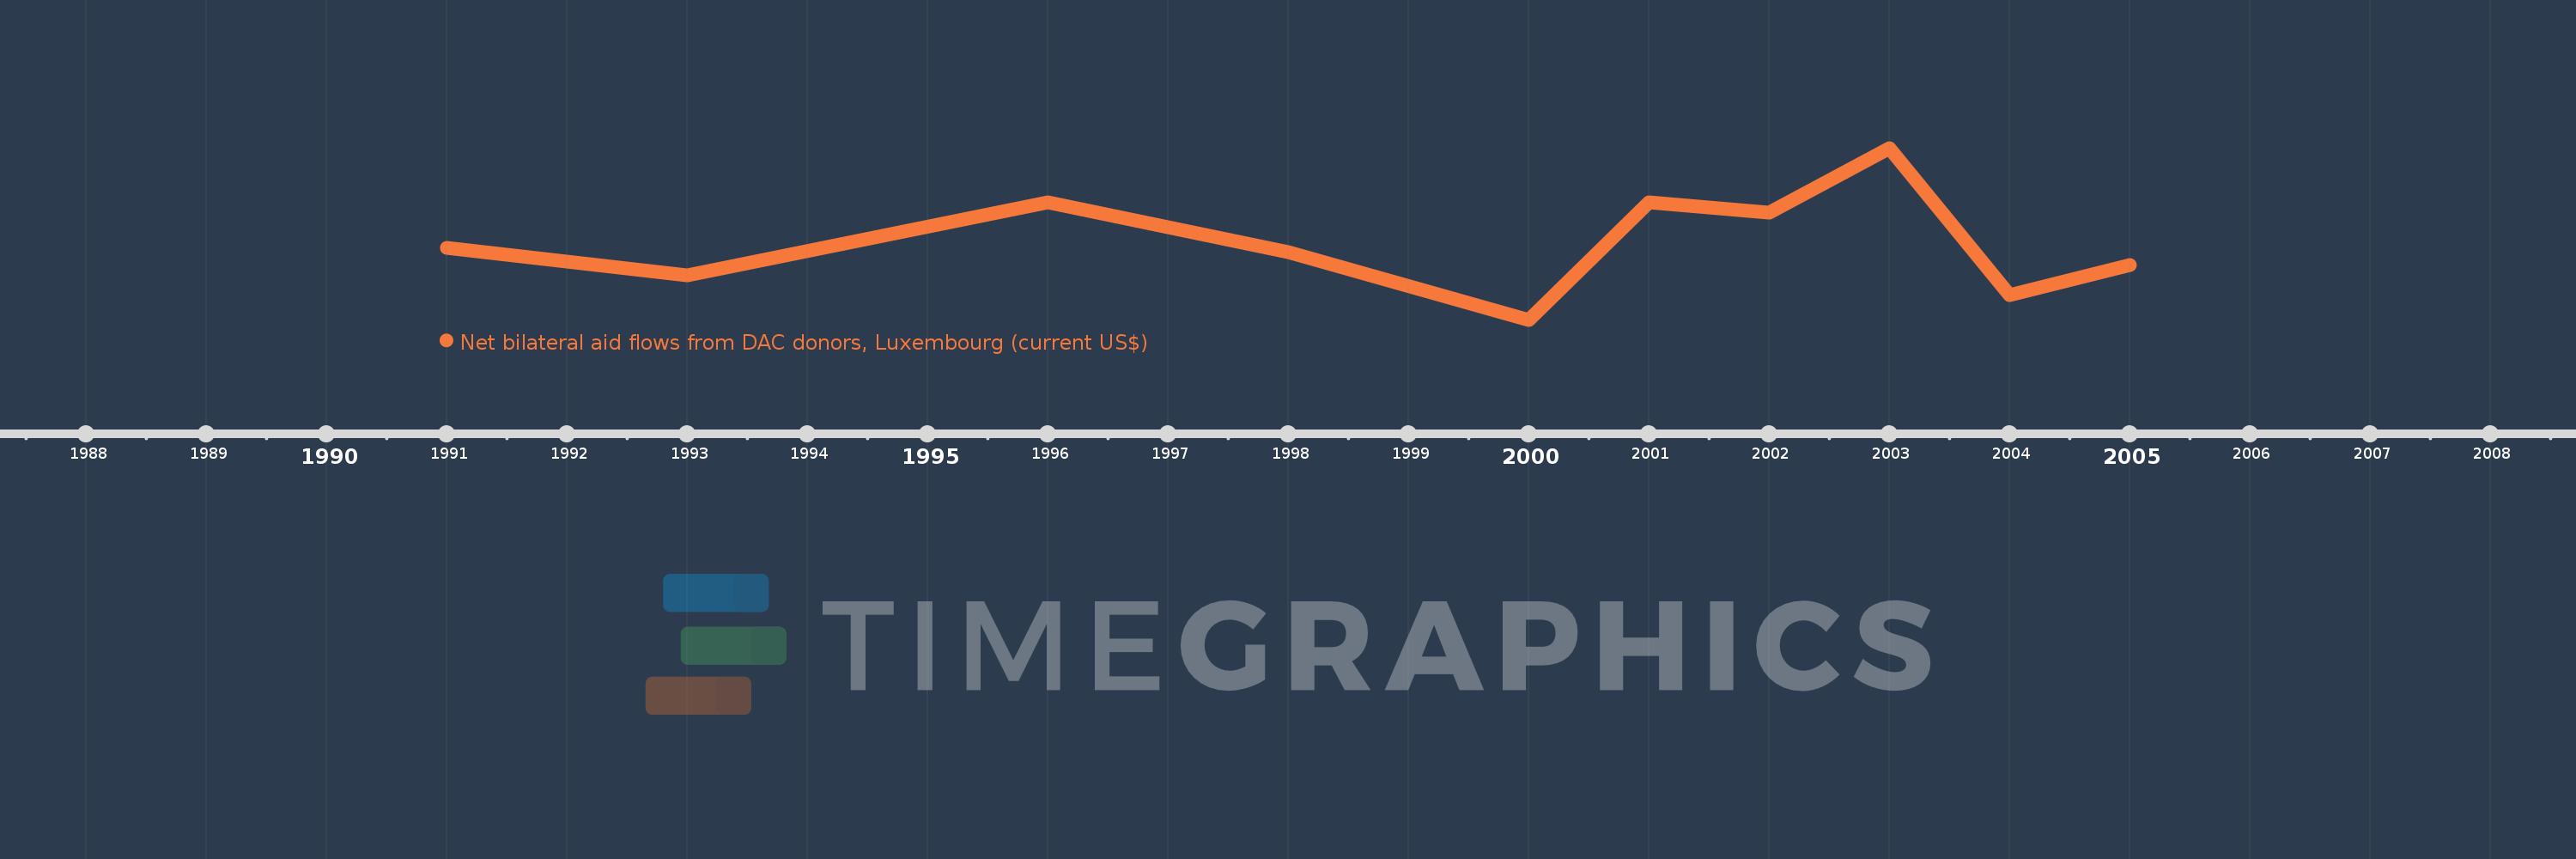
This timeline shows a graph from 1991 to 2005 of Angola. No data until 1990. Number of actual observations by date: 10.
Source name:
World Development Indicators
Source organization:
Development Assistance Committee of the Organisation for Economic Co-operation and Development, Geographical Distribution of Financial Flows to Developing Countries, Development Co-operation Report, and International Development Statistics database. Data are available online at: www.oecd.org/dac/stats/idsonline.
Categories, topics:
Aid Effectiveness
Last updated:
apr 23, 2017
Indicators value changes by year
Meaning:
322.0K
Minimum:
10.0K
jan 1, 2000
Maximum:
700.0K
jan 1, 2003
At the date of observation
Value
Absolute change
Change from the previous value
jan 1, 1991
300.0K
+300.0K
0.0%
jan 1, 1993
190.0K
-110.0K
-36.67%
jan 1, 1996
480.0K
+290.0K
152.63%
jan 1, 1998
280.0K
-200.0K
-41.67%
jan 1, 2000
10.0K
-270.0K
-96.43%
jan 1, 2001
480.0K
+470.0K
4.7K%
jan 1, 2002
440.0K
-40.0K
-8.33%
jan 1, 2003
700.0K
+260.0K
59.09%
jan 1, 2004
110.0K
-590.0K
-84.29%
jan 1, 2005
230.0K
+120.0K
109.09%
Ranking of countries by current statistics by years