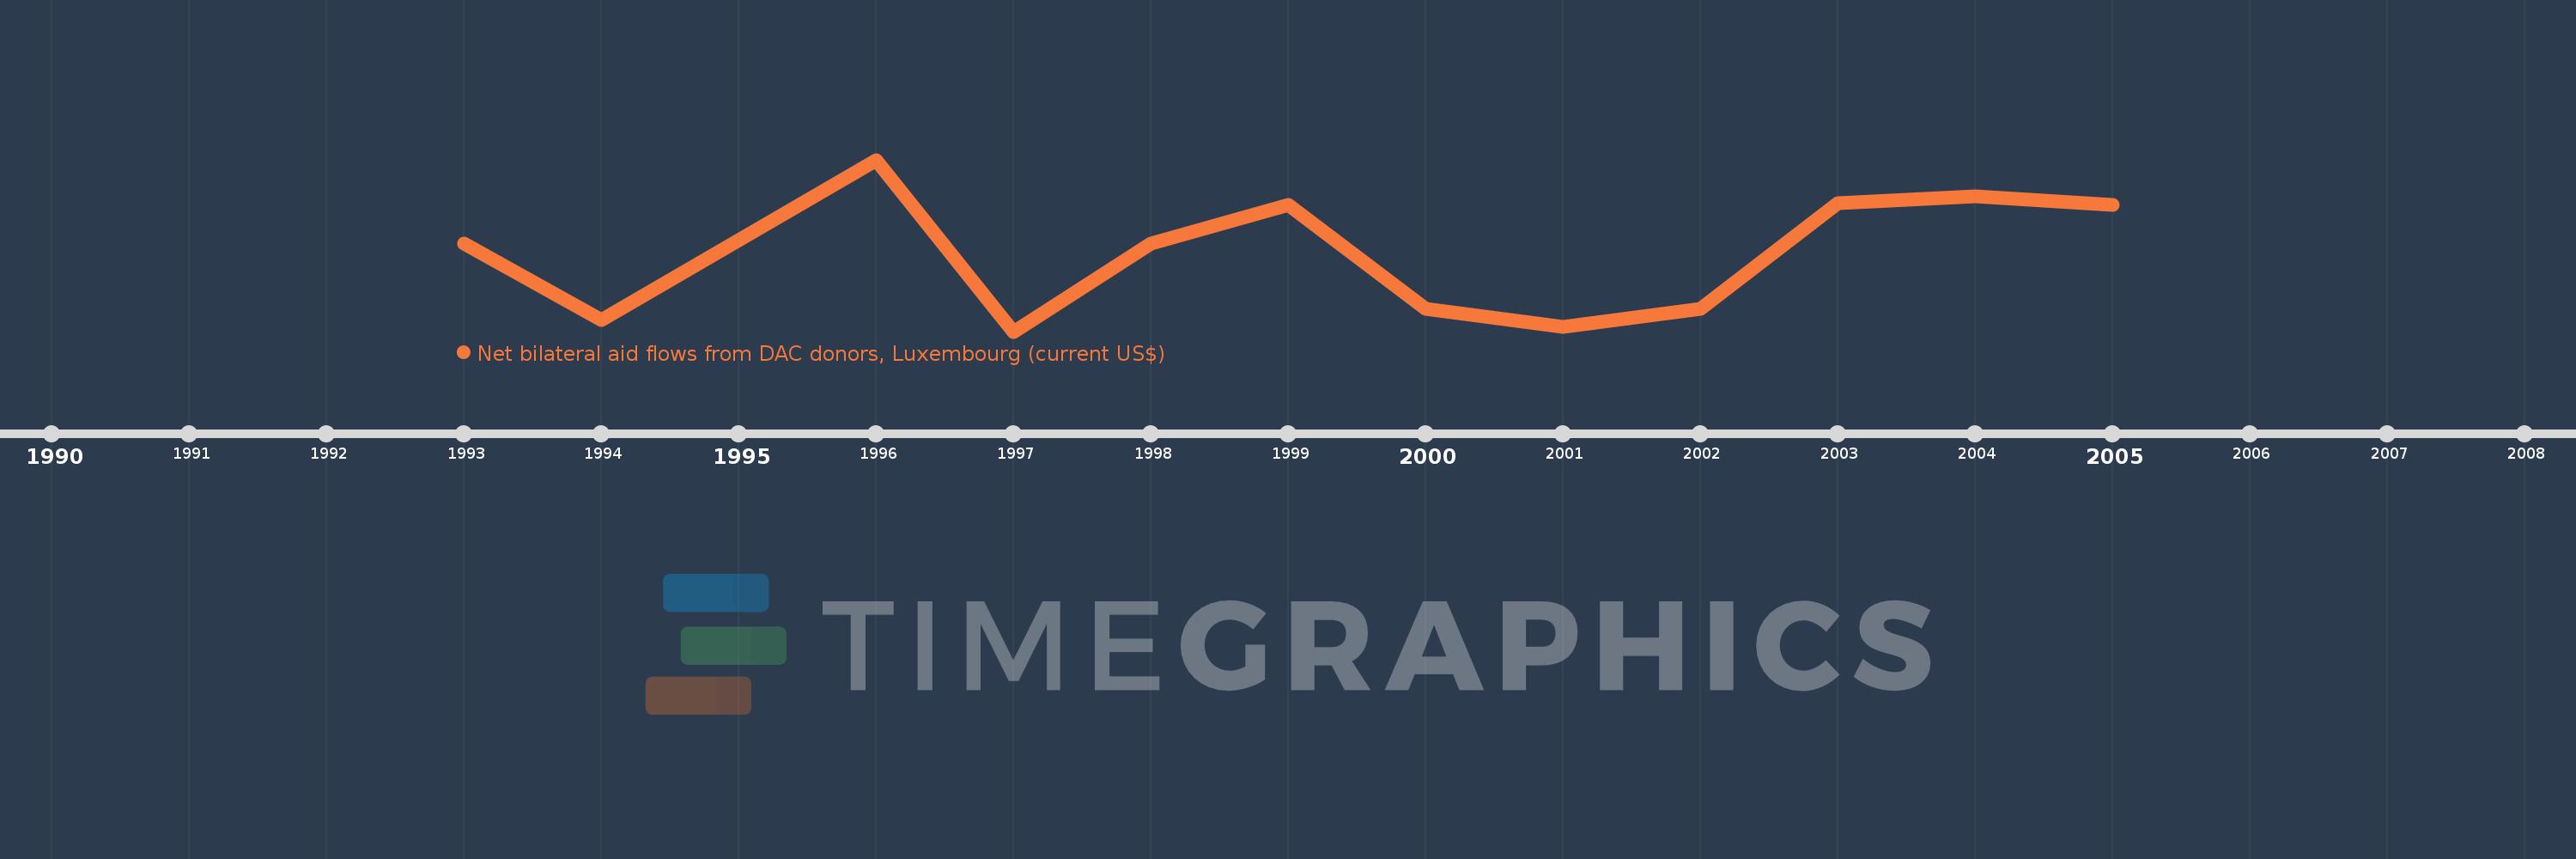
This timeline shows a graph from 1993 to 2005 of Russian Federation. No data until 1992. Number of actual observations by date: 12.
Source name:
World Development Indicators
Source organization:
Development Assistance Committee of the Organisation for Economic Co-operation and Development, Geographical Distribution of Financial Flows to Developing Countries, Development Co-operation Report, and International Development Statistics database. Data are available online at: www.oecd.org/dac/stats/idsonline.
Categories, topics:
Aid Effectiveness
Last updated:
apr 23, 2017
Indicators value changes by year
Meaning:
521.667K
Minimum:
180.0K
jan 1, 1997
Maximum:
940.0K
jan 1, 1996
At the date of observation
Value
Absolute change
Change from the previous value
jan 1, 1993
570.0K
+570.0K
0.0%
jan 1, 1994
230.0K
-340.0K
-59.65%
jan 1, 1996
940.0K
+710.0K
308.7%
jan 1, 1997
180.0K
-760.0K
-80.85%
jan 1, 1998
570.0K
+390.0K
216.67%
jan 1, 1999
740.0K
+170.0K
29.82%
jan 1, 2000
280.0K
-460.0K
-62.16%
jan 1, 2001
200.0K
-80.0K
-28.57%
jan 1, 2002
280.0K
+80.0K
40.0%
jan 1, 2003
750.0K
+470.0K
167.86%
jan 1, 2004
780.0K
+30.0K
4.0%
jan 1, 2005
740.0K
-40.0K
-5.13%
Ranking of countries by current statistics by years