33
/
AIzaSyAYiBZKx7MnpbEhh9jyipgxe19OcubqV5w
August 1, 2025
185527
Madagascar
MDG
true
2
1
Net bilateral aid flows from DAC donors, Luxembourg (current US$)
2015,2014,2013,2012,2011,2010,2009,2008,2007,2006,2005,2004,2003,2001,2000,1999,1998,1997,1996,1993
Download
Global statistics library →Madagascar →

Net bilateral aid flows from DAC donors, Luxembourg (current US$)

This statistics in other country:

AfghanistanAlbaniaAlgeriaAngolaArab WorldArgentinaArmeniaAzerbaijanBangladeshBelarusBelizeBeninBhutanBoliviaBosnia and HerzegovinaBotswanaBrazilBulgariaBurkina FasoBurundiCabo VerdeCambodiaCameroonCaribbean small statesCentral African RepublicCentral Europe and the BalticsChadChileChinaColombiaComorosCongo, Dem. Rep.Congo, Rep.Costa RicaCote d'IvoireCroatiaCubaCzech RepublicDjiboutiDominicaDominican RepublicEast Asia & PacificEast Asia & Pacific (excluding high income)East Asia & Pacific (IDA & IBRD countries)EcuadorEgypt, Arab Rep.El SalvadorEquatorial GuineaEritreaEstoniaEthiopiaEuro areaEurope & Central AsiaEurope & Central Asia (excluding high income)Europe & Central Asia (IDA & IBRD countries)European UnionFijiFragile and conflict affected situationsGabonGambia, TheGeorgiaGhanaGrenadaGuatemalaGuineaGuinea-BissauGuyanaHaitiHeavily indebted poor countries (HIPC)High incomeHondurasHungaryIBRD onlyIDA & IBRD totalIDA blendIDA onlyIDA totalIndiaIndonesiaIran, Islamic Rep.IraqIsraelJamaicaJordanKazakhstanKenyaKorea, Dem. People’s Rep.Korea, Rep.KosovoKyrgyz RepublicLao PDRLatin America & Caribbean Latin America & Caribbean (excluding high income)Latin America & the Caribbean (IDA & IBRD countries)LatviaLeast developed countries: UN classificationLebanonLesothoLiberiaLibyaLithuaniaLow & middle incomeLow incomeLower middle incomeMacedonia, FYRMadagascarMalawiMalaysiaMaldivesMaliMauritaniaMauritiusMexicoMicronesia, Fed. Sts.Middle East & North AfricaMiddle East & North Africa (excluding high income)Middle East & North Africa (IDA & IBRD countries)Middle incomeMoldovaMongoliaMontenegroMoroccoMozambiqueMyanmarNamibiaNepalNicaraguaNigerNigeriaOECD membersOther small statesPacific island small statesPakistanPalauPanamaParaguayPeruPhilippinesPolandRomaniaRussian FederationRwandaSamoaSao Tome and PrincipeSenegalSerbiaSierra LeoneSlovak RepublicSloveniaSmall statesSomaliaSouth AfricaSouth AsiaSouth Asia (IDA & IBRD)South SudanSri LankaSt. LuciaSub-Saharan Africa Sub-Saharan Africa (excluding high income)Sub-Saharan Africa (IDA & IBRD countries)SudanSwazilandSyrian Arab RepublicTajikistanTanzaniaThailandTimor-LesteTogoTunisiaTurkeyTurkmenistanUgandaUkraineUpper middle incomeUruguayUzbekistanVanuatuVenezuela, RBVietnamWest Bank and GazaWorldYemen, Rep.ZambiaZimbabwe

Timeline:

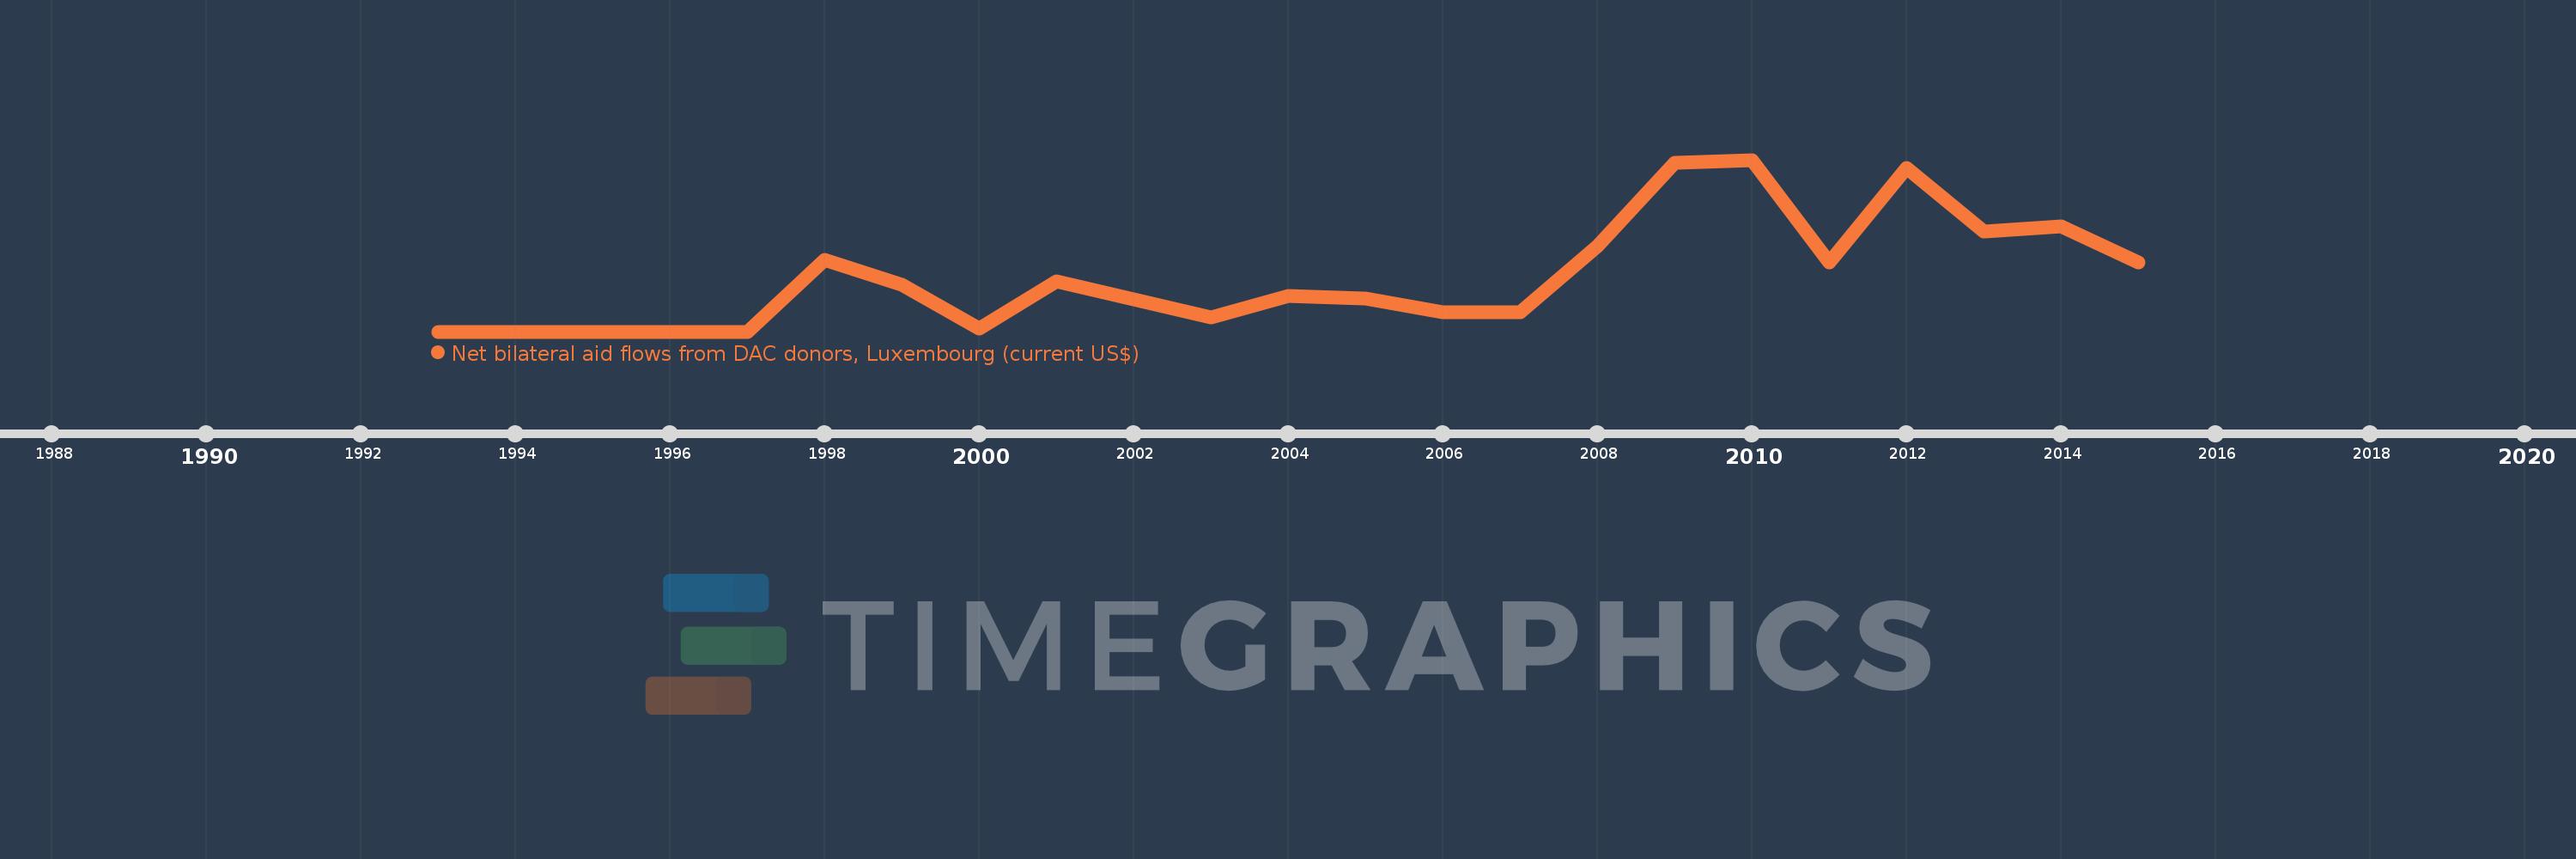
This timeline shows a graph from 1993 to 2015 of Madagascar. No data until 1992. Number of actual observations by date: 20.

Source name:

World Development Indicators

Source organization:

Development Assistance Committee of the Organisation for Economic Co-operation and Development, Geographical Distribution of Financial Flows to Developing Countries, Development Co-operation Report, and International Development Statistics database. Data are available online at: www.oecd.org/dac/stats/idsonline.

Categories, topics:

Aid Effectiveness

Last updated:

apr 23, 2017

Indicators value changes by year

Meaning:
251.5K
Minimum:
30.0K
jan 1, 1993
Maximum:
650.0K
jan 1, 2010
At the date of observation
Value
Absolute change
Change from the previous value
jan 1, 1993
30.0K
+30.0K
0.0%
jan 1, 1996
30.0K
0.0
0.0%
jan 1, 1997
30.0K
0.0
0.0%
jan 1, 1998
290.0K
+260.0K
866.67%
jan 1, 1999
200.0K
-90.0K
-31.03%
jan 1, 2000
40.0K
-160.0K
-80.0%
jan 1, 2001
210.0K
+170.0K
425.0%
jan 1, 2003
80.0K
-130.0K
-61.9%
jan 1, 2004
160.0K
+80.0K
100.0%
jan 1, 2005
150.0K
-10.0K
-6.25%
jan 1, 2006
100.0K
-50.0K
-33.33%
jan 1, 2007
100.0K
0.0
0.0%
jan 1, 2008
340.0K
+240.0K
240.0%
jan 1, 2009
640.0K
+300.0K
88.24%
jan 1, 2010
650.0K
+10.0K
1.56%
jan 1, 2011
280.0K
-370.0K
-56.92%
jan 1, 2012
620.0K
+340.0K
121.43%
jan 1, 2013
390.0K
-230.0K
-37.1%
jan 1, 2014
410.0K
+20.0K
5.13%
jan 1, 2015
280.0K
-130.0K
-31.71%

Ranking of countries by current statistics by years