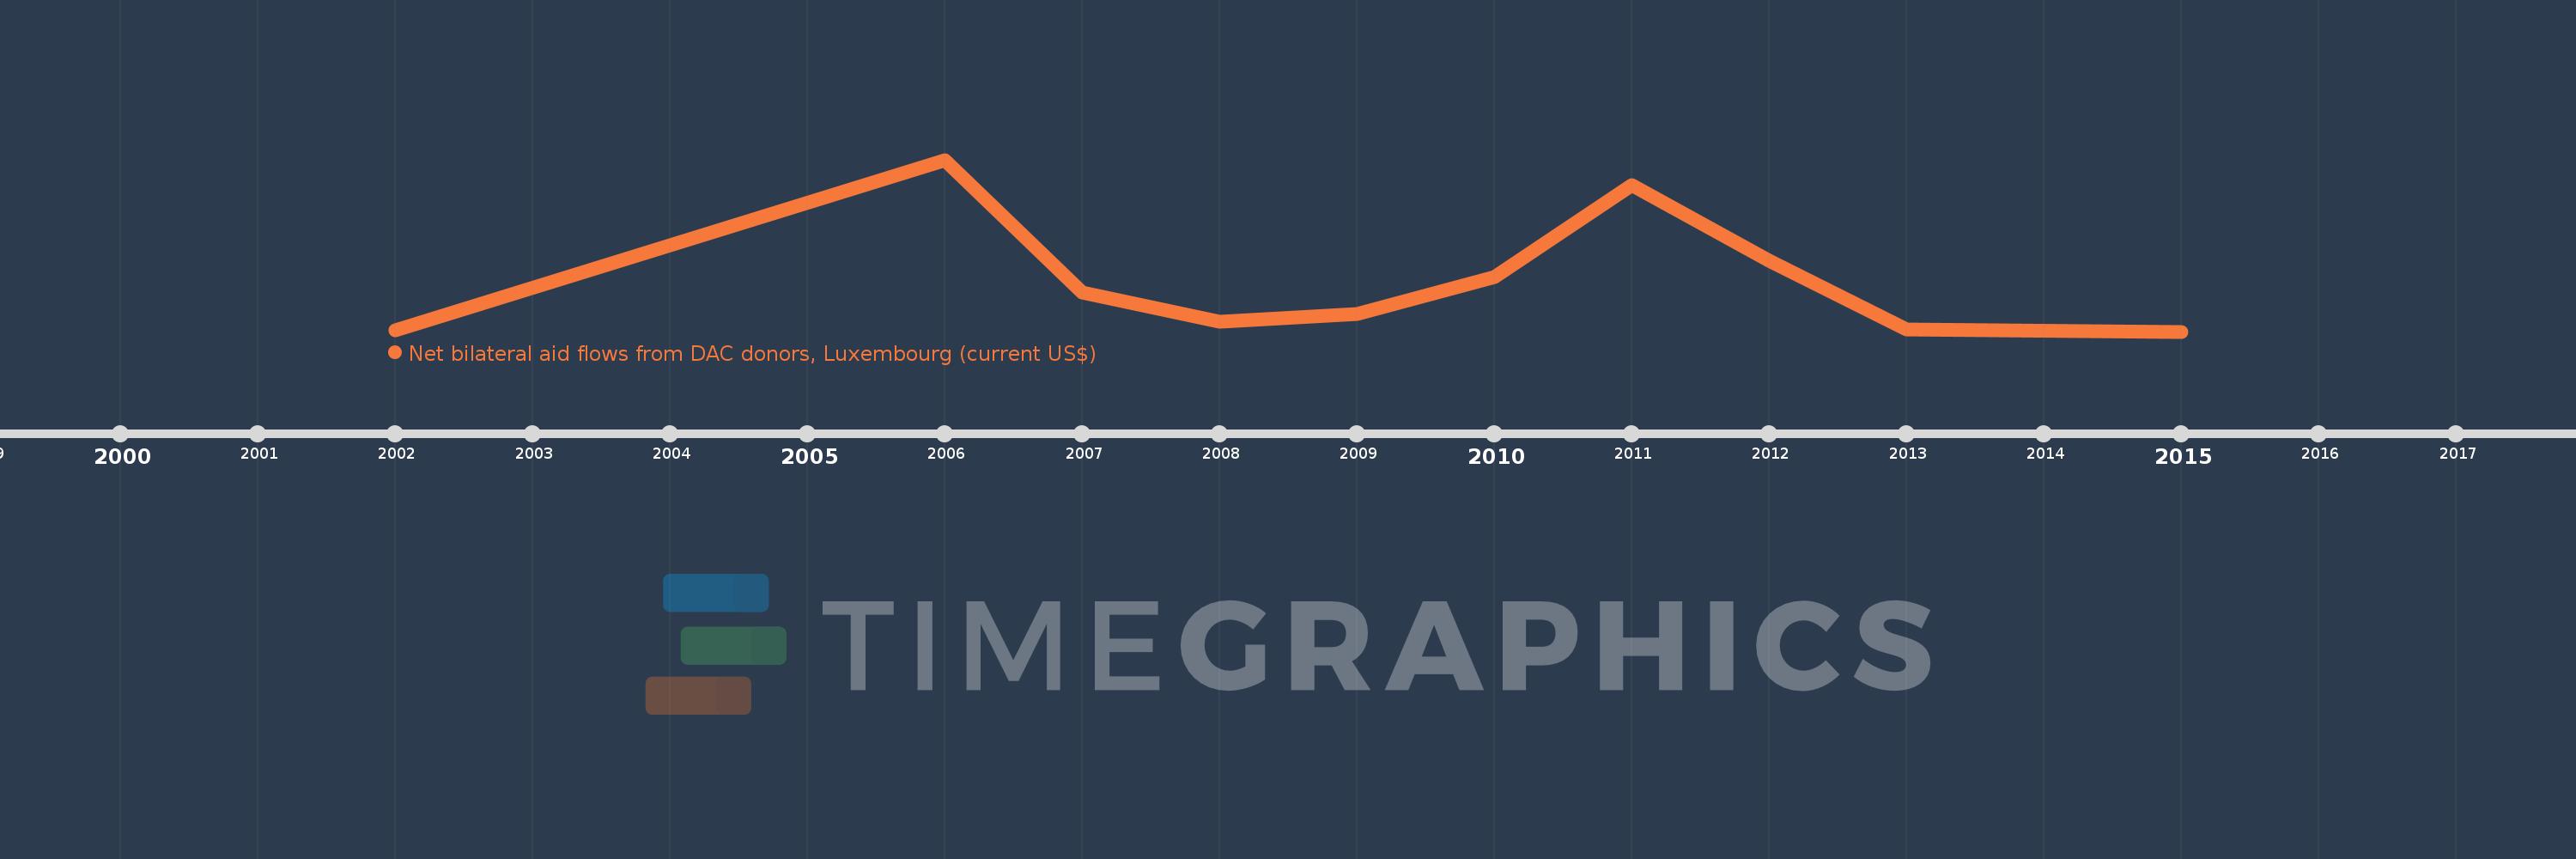
This timeline shows a graph from 2002 to 2015 of Pakistan. No data until 2001. Number of actual observations by date: 10.
Source name:
World Development Indicators
Source organization:
Development Assistance Committee of the Organisation for Economic Co-operation and Development, Geographical Distribution of Financial Flows to Developing Countries, Development Co-operation Report, and International Development Statistics database. Data are available online at: www.oecd.org/dac/stats/idsonline.
Categories, topics:
Aid Effectiveness
Last updated:
apr 23, 2017
Indicators value changes by year
Meaning:
1.429 mln
Minimum:
180.0K
jan 1, 2015
Maximum:
4.35 mln
jan 1, 2006
At the date of observation
Value
Absolute change
Change from the previous value
jan 1, 2002
220.0K
+220.0K
0.0%
jan 1, 2006
4.35 mln
+4.13 mln
1.88K%
jan 1, 2007
1.13 mln
-3.22 mln
-74.02%
jan 1, 2008
430.0K
-700.0K
-61.95%
jan 1, 2009
610.0K
+180.0K
41.86%
jan 1, 2010
1.51 mln
+900.0K
147.54%
jan 1, 2011
3.74 mln
+2.23 mln
147.68%
jan 1, 2012
1.89 mln
-1.85 mln
-49.47%
jan 1, 2013
230.0K
-1.66 mln
-87.83%
jan 1, 2015
180.0K
-50.0K
-21.74%
Ranking of countries by current statistics by years