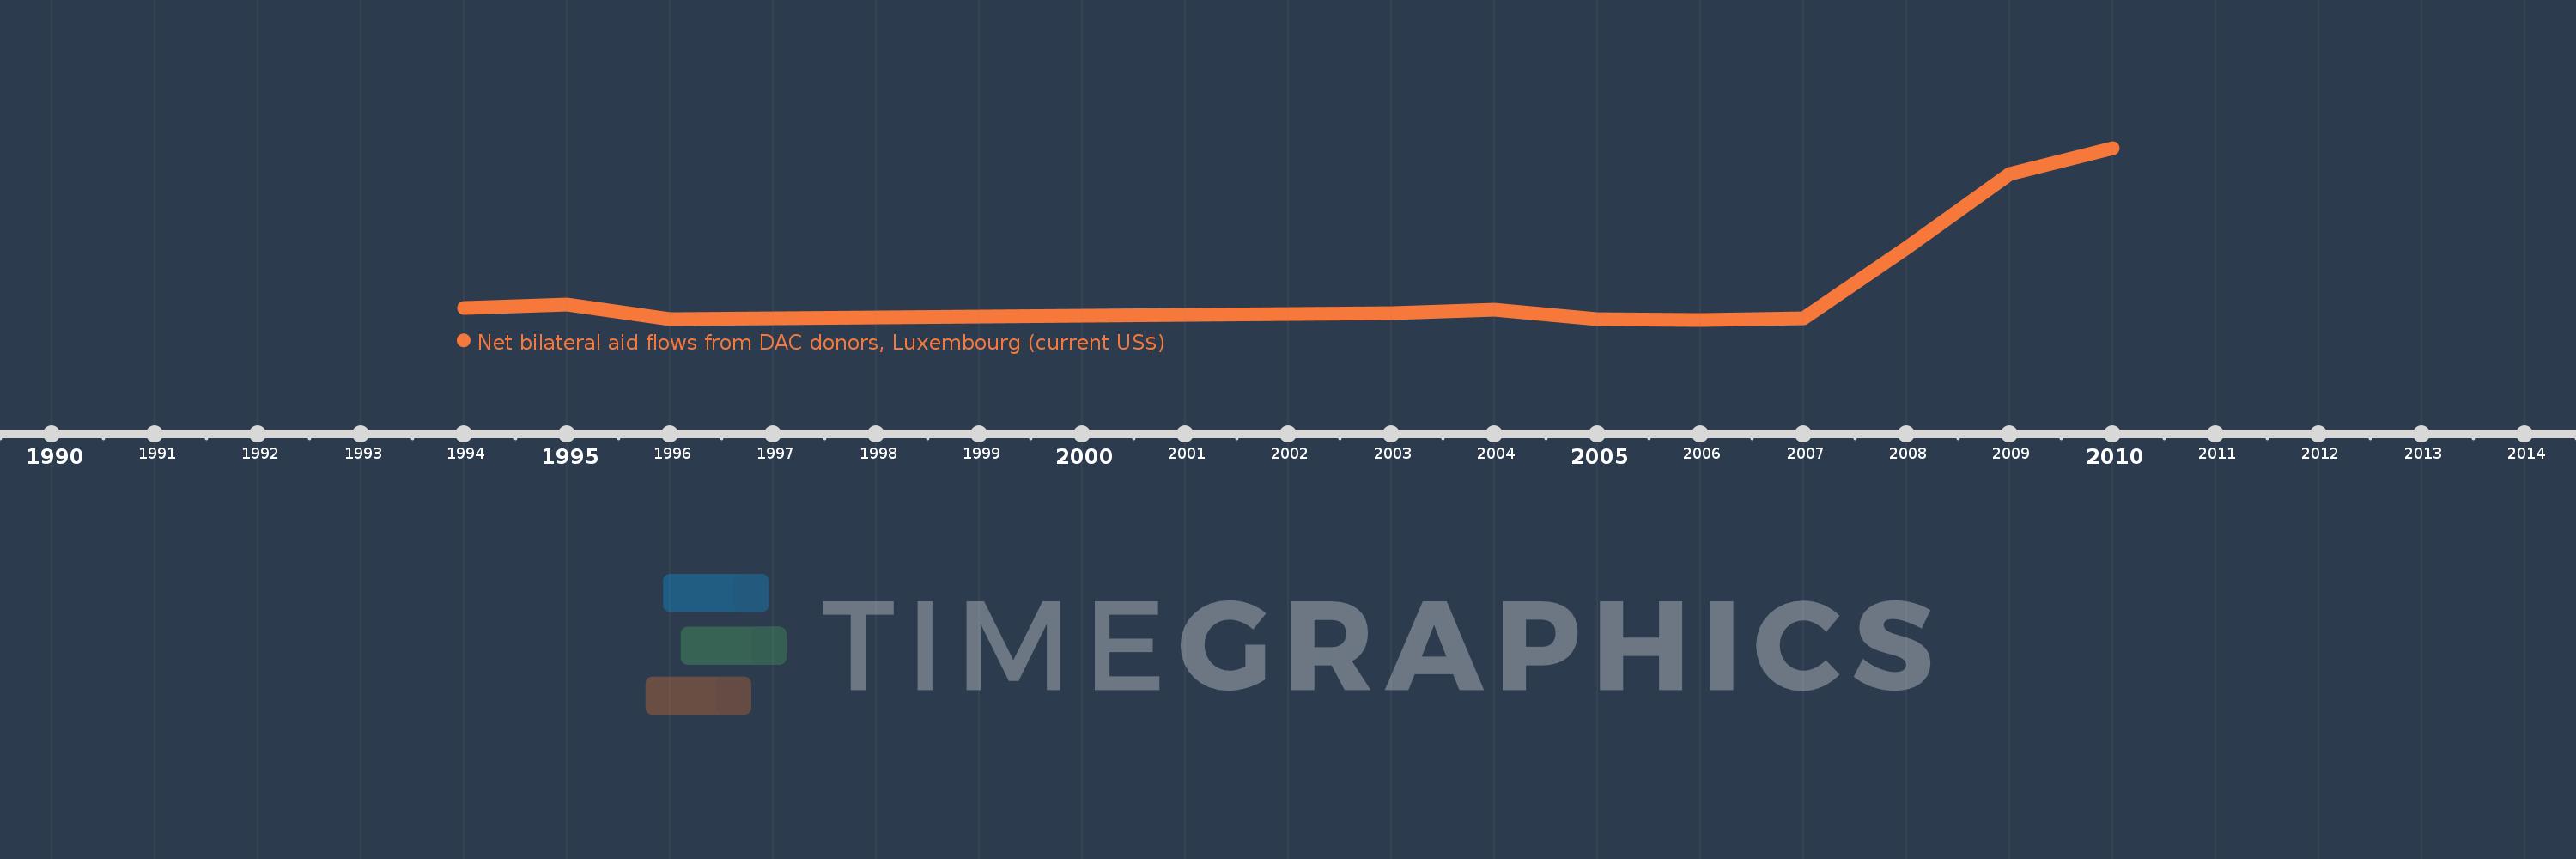
This timeline shows a graph from 1994 to 2010 of Zimbabwe. No data until 1993. Number of actual observations by date: 11.
Source name:
World Development Indicators
Source organization:
Development Assistance Committee of the Organisation for Economic Co-operation and Development, Geographical Distribution of Financial Flows to Developing Countries, Development Co-operation Report, and International Development Statistics database. Data are available online at: www.oecd.org/dac/stats/idsonline.
Categories, topics:
Aid Effectiveness
Last updated:
apr 23, 2017
Indicators value changes by year
Meaning:
578.182K
Minimum:
10.0K
jan 1, 2006
Maximum:
2.47 mln
jan 1, 2010
At the date of observation
Value
Absolute change
Change from the previous value
jan 1, 1994
180.0K
+180.0K
0.0%
jan 1, 1995
230.0K
+50.0K
27.78%
jan 1, 1996
20.0K
-210.0K
-91.3%
jan 1, 2003
110.0K
+90.0K
450.0%
jan 1, 2004
150.0K
+40.0K
36.36%
jan 1, 2005
20.0K
-130.0K
-86.67%
jan 1, 2006
10.0K
-10.0K
-50.0%
jan 1, 2007
30.0K
+20.0K
200.0%
jan 1, 2008
1.04 mln
+1.01 mln
3.37K%
jan 1, 2009
2.1 mln
+1.06 mln
101.92%
jan 1, 2010
2.47 mln
+370.0K
17.62%
Ranking of countries by current statistics by years