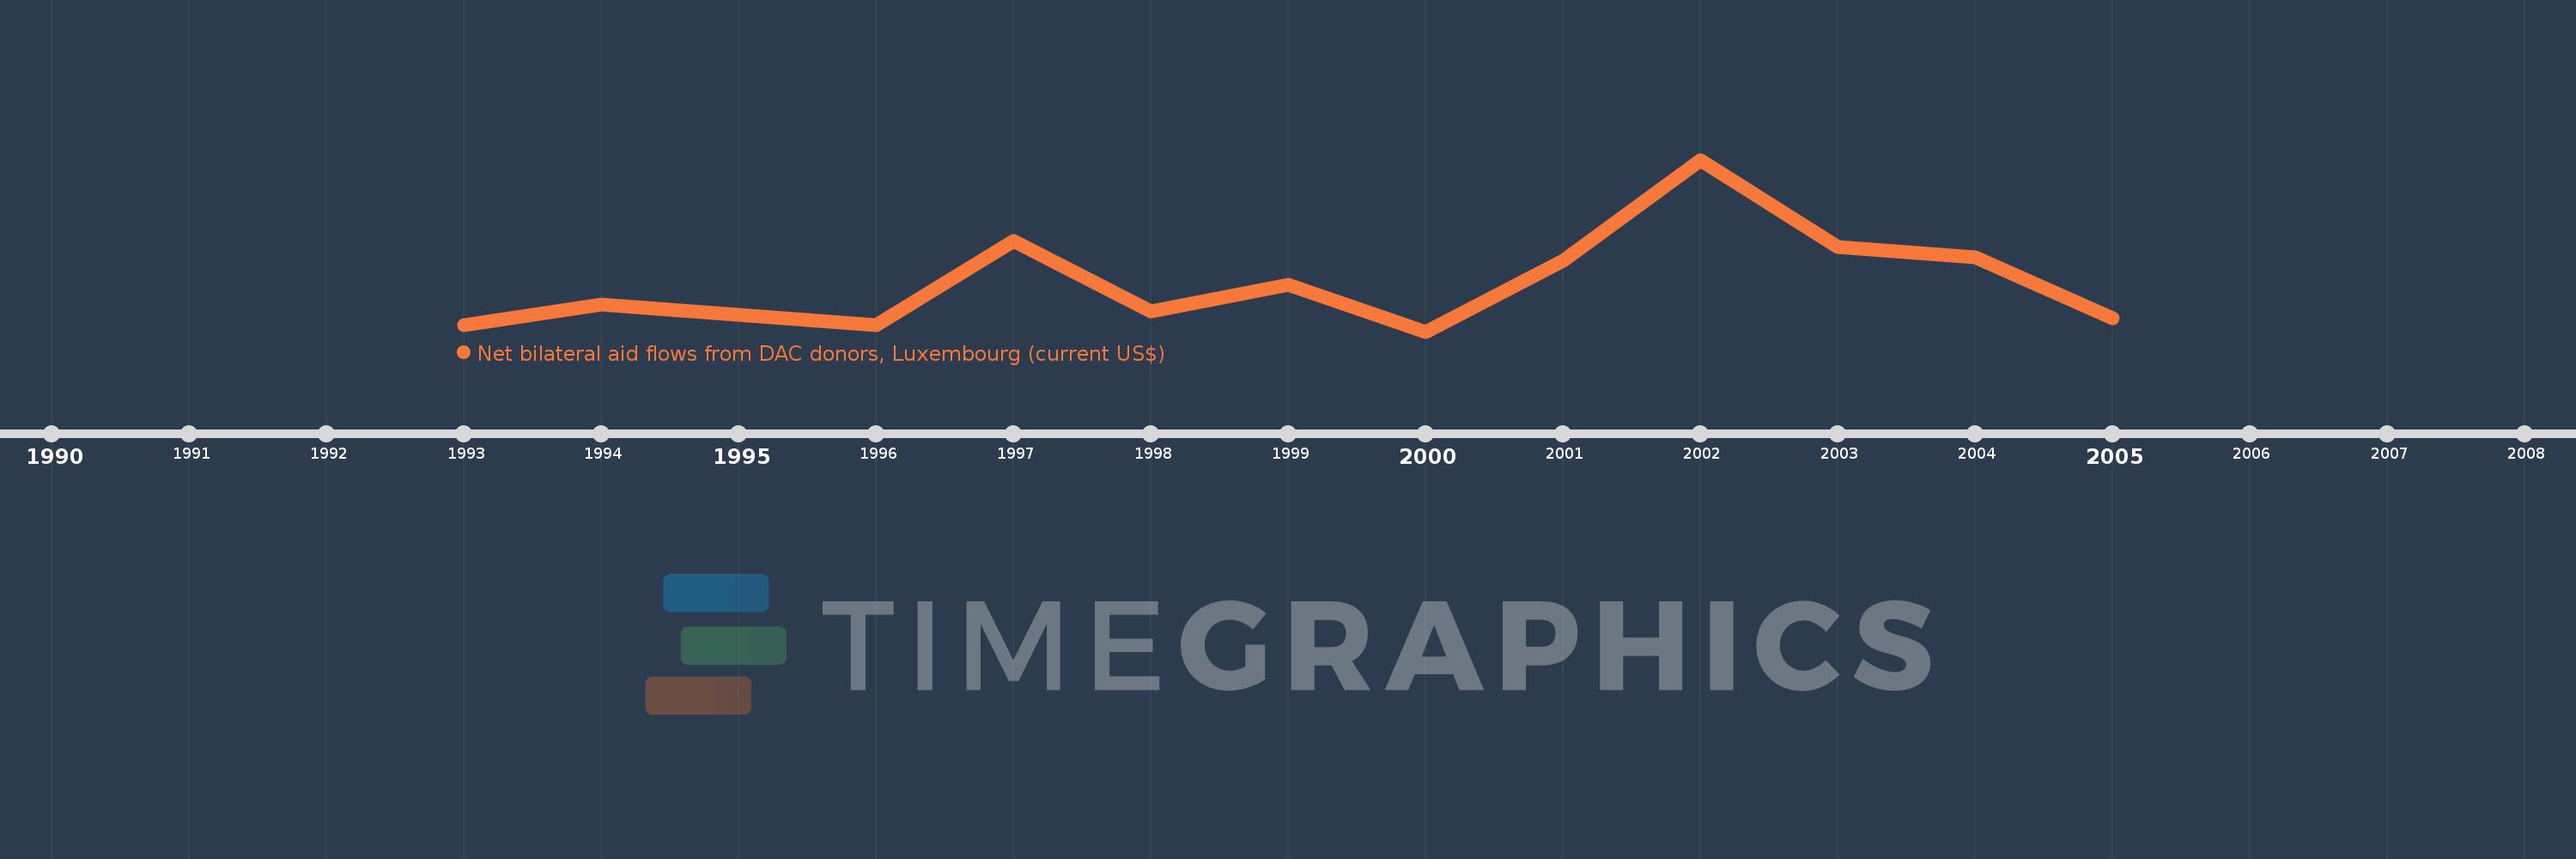
This timeline shows a graph from 1993 to 2005 of Romania. No data until 1992. Number of actual observations by date: 12.
Source name:
World Development Indicators
Source organization:
Development Assistance Committee of the Organisation for Economic Co-operation and Development, Geographical Distribution of Financial Flows to Developing Countries, Development Co-operation Report, and International Development Statistics database. Data are available online at: www.oecd.org/dac/stats/idsonline.
Categories, topics:
Aid Effectiveness
Last updated:
apr 23, 2017
Indicators value changes by year
Meaning:
281.667K
Minimum:
130.0K
jan 1, 2000
Maximum:
640.0K
jan 1, 2002
At the date of observation
Value
Absolute change
Change from the previous value
jan 1, 1993
150.0K
+150.0K
0.0%
jan 1, 1994
210.0K
+60.0K
40.0%
jan 1, 1996
150.0K
-60.0K
-28.57%
jan 1, 1997
400.0K
+250.0K
166.67%
jan 1, 1998
190.0K
-210.0K
-52.5%
jan 1, 1999
270.0K
+80.0K
42.11%
jan 1, 2000
130.0K
-140.0K
-51.85%
jan 1, 2001
340.0K
+210.0K
161.54%
jan 1, 2002
640.0K
+300.0K
88.24%
jan 1, 2003
380.0K
-260.0K
-40.63%
jan 1, 2004
350.0K
-30.0K
-7.89%
jan 1, 2005
170.0K
-180.0K
-51.43%
Ranking of countries by current statistics by years