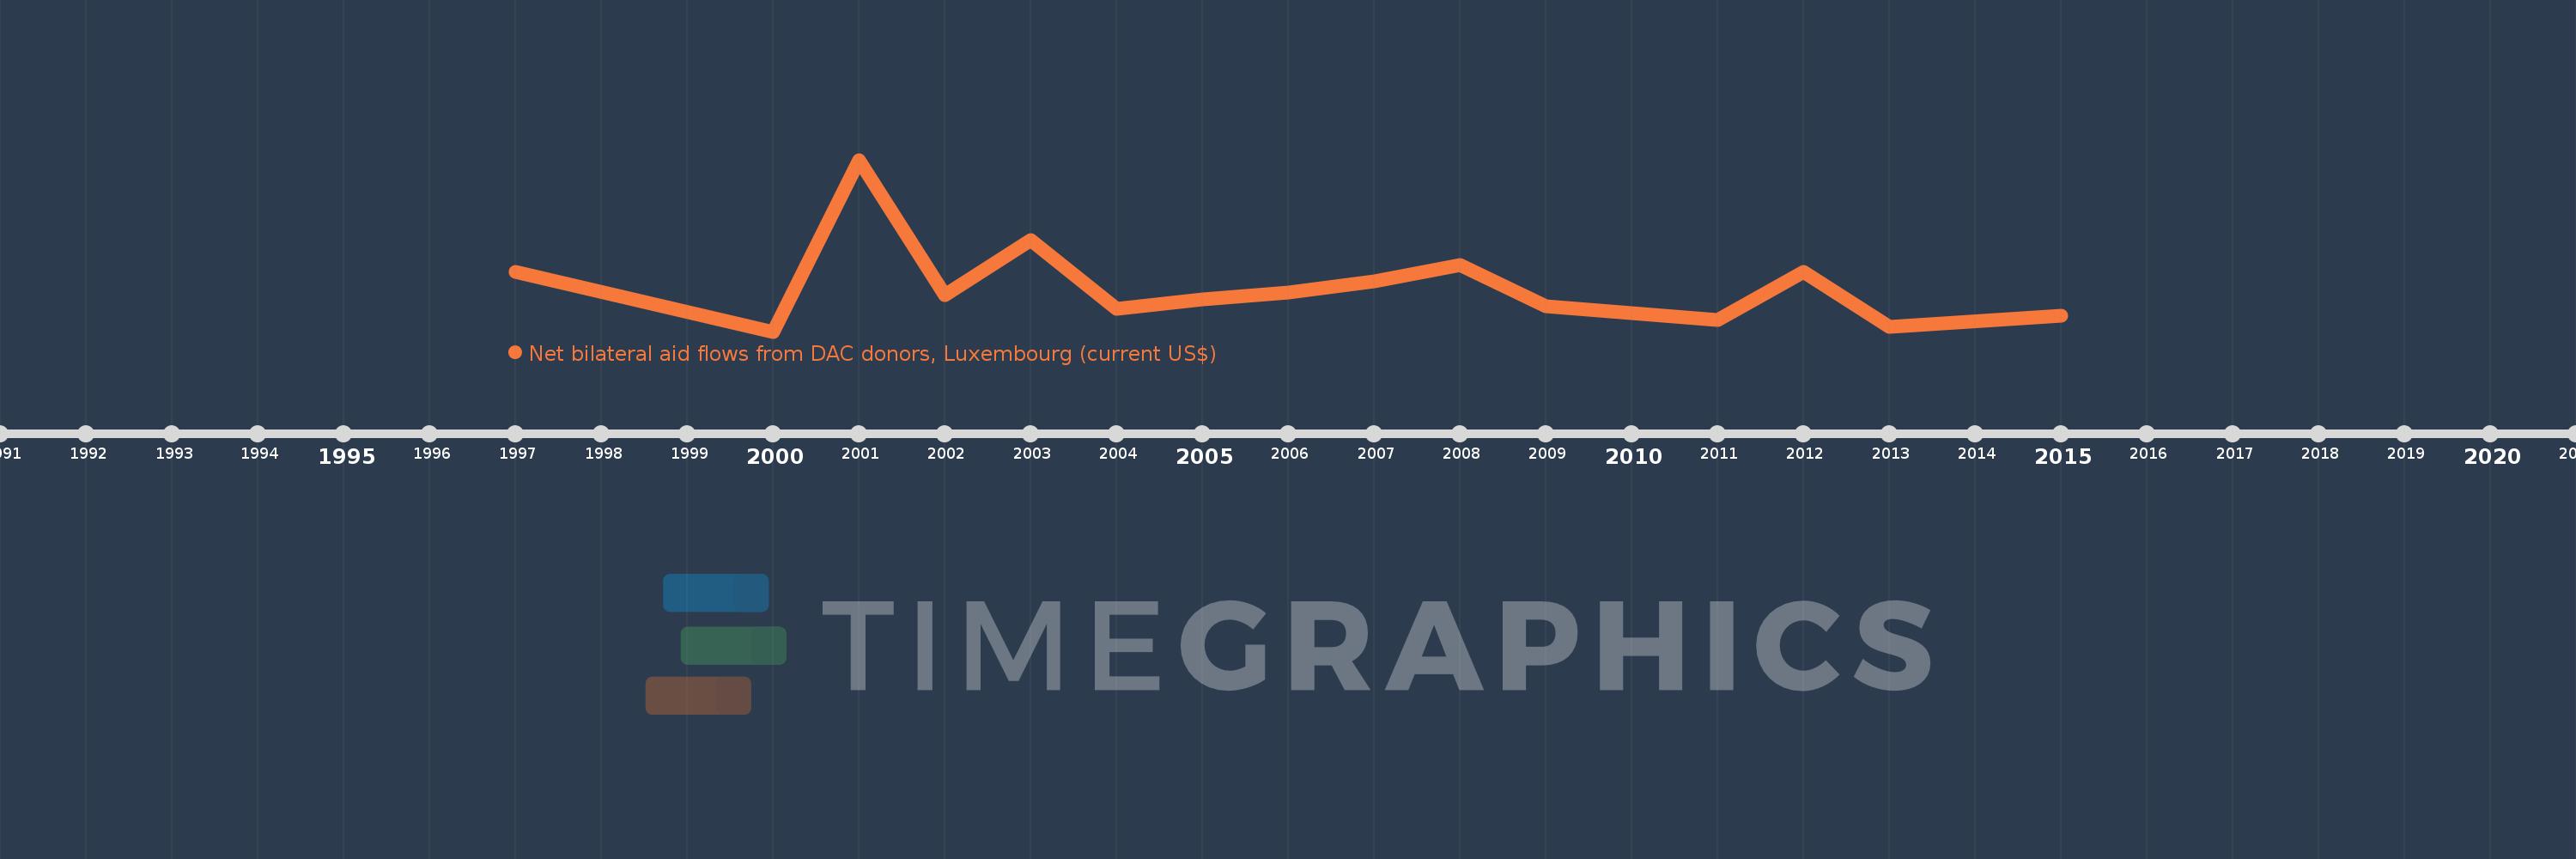
This timeline shows a graph from 1997 to 2015 of Congo, Rep.. No data until 1996. Number of actual observations by date: 15.
Source name:
World Development Indicators
Source organization:
Development Assistance Committee of the Organisation for Economic Co-operation and Development, Geographical Distribution of Financial Flows to Developing Countries, Development Co-operation Report, and International Development Statistics database. Data are available online at: www.oecd.org/dac/stats/idsonline.
Categories, topics:
Aid Effectiveness
Last updated:
apr 23, 2017
Indicators value changes by year
Meaning:
220.0K
Minimum:
20.0K
jan 1, 2000
Maximum:
770.0K
jan 1, 2001
At the date of observation
Value
Absolute change
Change from the previous value
jan 1, 1997
280.0K
+280.0K
0.0%
jan 1, 2000
20.0K
-260.0K
-92.86%
jan 1, 2001
770.0K
+750.0K
3.75K%
jan 1, 2002
180.0K
-590.0K
-76.62%
jan 1, 2003
420.0K
+240.0K
133.33%
jan 1, 2004
120.0K
-300.0K
-71.43%
jan 1, 2005
160.0K
+40.0K
33.33%
jan 1, 2006
190.0K
+30.0K
18.75%
jan 1, 2007
240.0K
+50.0K
26.32%
jan 1, 2008
310.0K
+70.0K
29.17%
jan 1, 2009
130.0K
-180.0K
-58.06%
jan 1, 2011
70.0K
-60.0K
-46.15%
jan 1, 2012
280.0K
+210.0K
300.0%
jan 1, 2013
40.0K
-240.0K
-85.71%
jan 1, 2015
90.0K
+50.0K
125.0%
Ranking of countries by current statistics by years