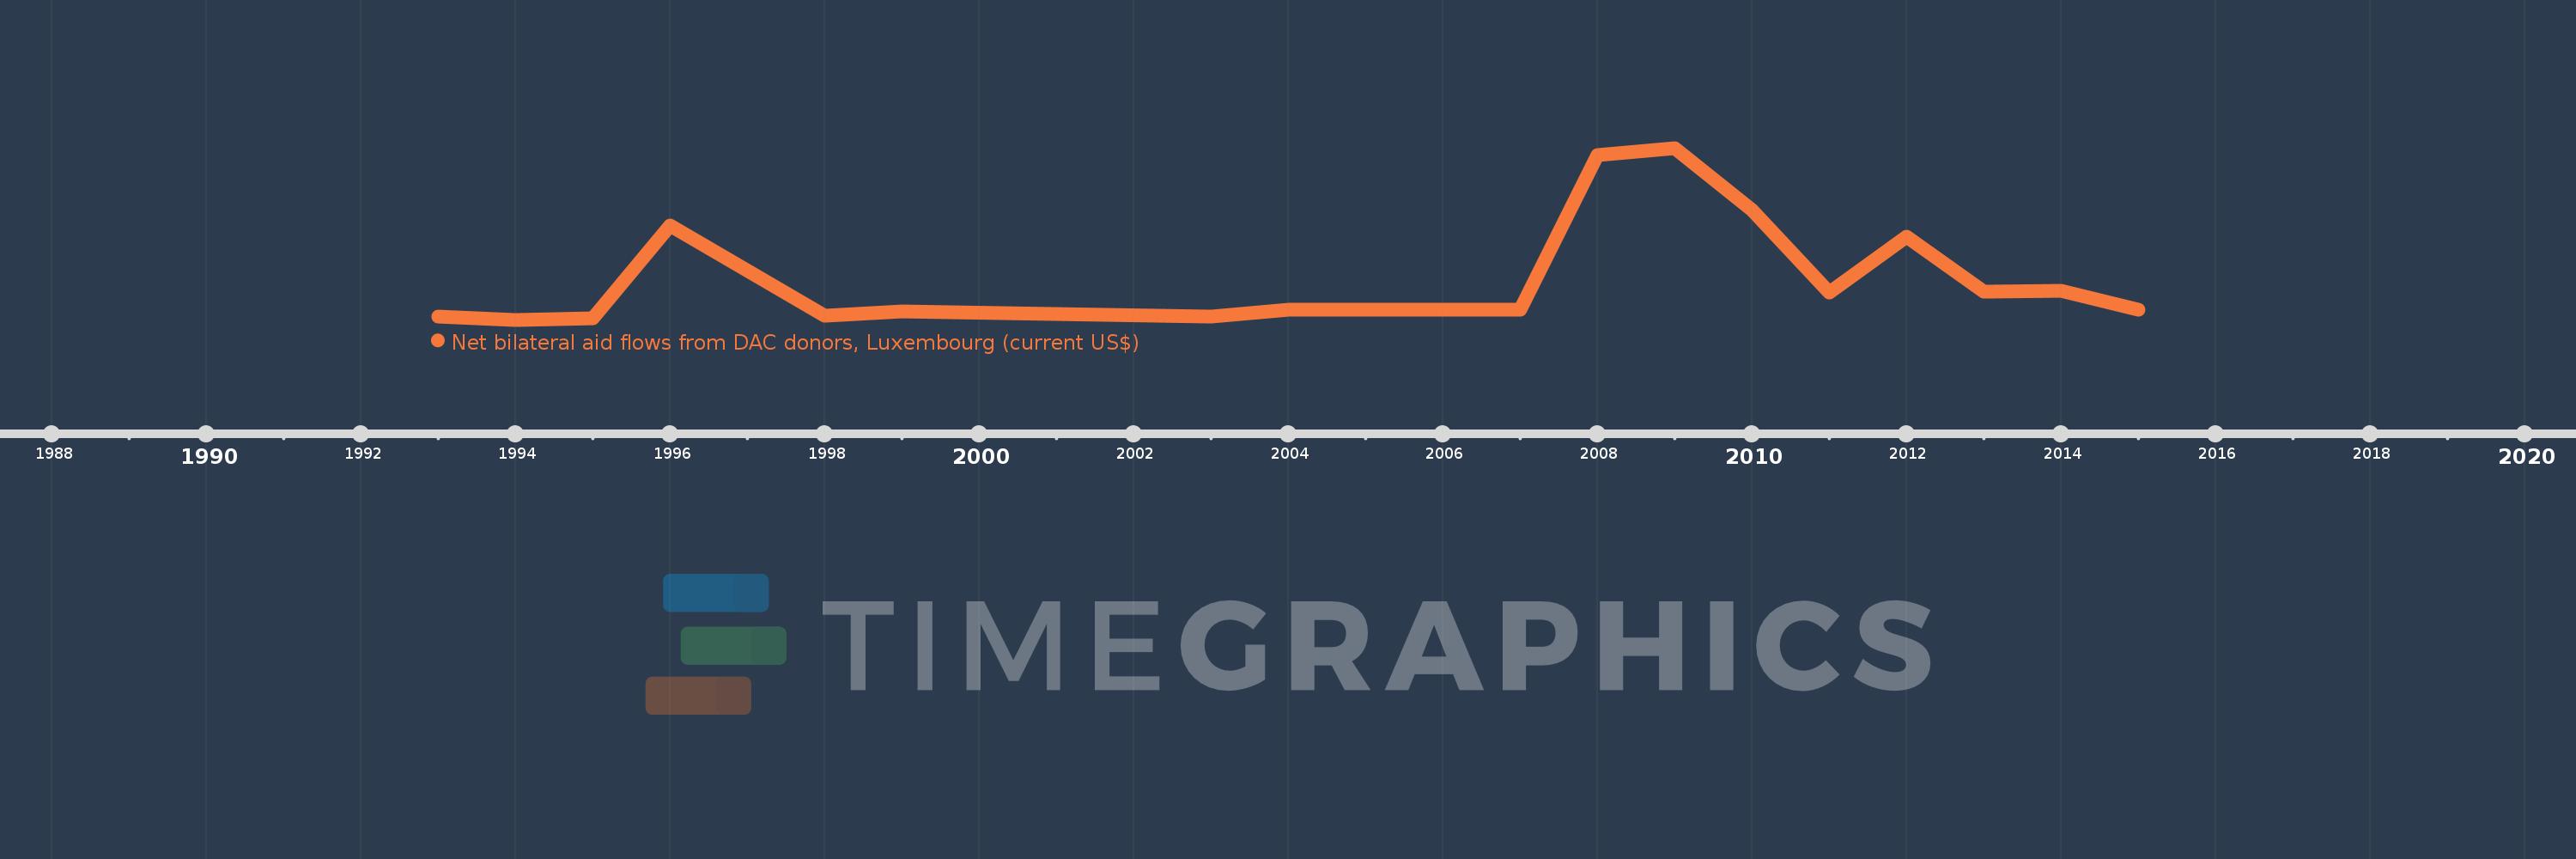
This timeline shows a graph from 1993 to 2015 of Uganda. No data until 1992. Number of actual observations by date: 19.
Source name:
World Development Indicators
Source organization:
Development Assistance Committee of the Organisation for Economic Co-operation and Development, Geographical Distribution of Financial Flows to Developing Countries, Development Co-operation Report, and International Development Statistics database. Data are available online at: www.oecd.org/dac/stats/idsonline.
Categories, topics:
Aid Effectiveness
Last updated:
apr 23, 2017
Indicators value changes by year
Meaning:
400.0K
Minimum:
20.0K
jan 1, 1994
Maximum:
1.62 mln
jan 1, 2009
At the date of observation
Value
Absolute change
Change from the previous value
jan 1, 1993
50.0K
+50.0K
0.0%
jan 1, 1994
20.0K
-30.0K
-60.0%
jan 1, 1995
30.0K
+10.0K
50.0%
jan 1, 1996
900.0K
+870.0K
2.9K%
jan 1, 1998
60.0K
-840.0K
-93.33%
jan 1, 1999
100.0K
+40.0K
66.67%
jan 1, 2003
50.0K
-50.0K
-50.0%
jan 1, 2004
110.0K
+60.0K
120.0%
jan 1, 2005
110.0K
0.0
0.0%
jan 1, 2006
110.0K
0.0
0.0%
jan 1, 2007
110.0K
0.0
0.0%
jan 1, 2008
1.55 mln
+1.44 mln
1.31K%
jan 1, 2009
1.62 mln
+70.0K
4.52%
jan 1, 2010
1.04 mln
-580.0K
-35.8%
jan 1, 2011
270.0K
-770.0K
-74.04%
jan 1, 2012
790.0K
+520.0K
192.59%
jan 1, 2013
280.0K
-510.0K
-64.56%
jan 1, 2014
290.0K
+10.0K
3.57%
jan 1, 2015
110.0K
-180.0K
-62.07%
Ranking of countries by current statistics by years