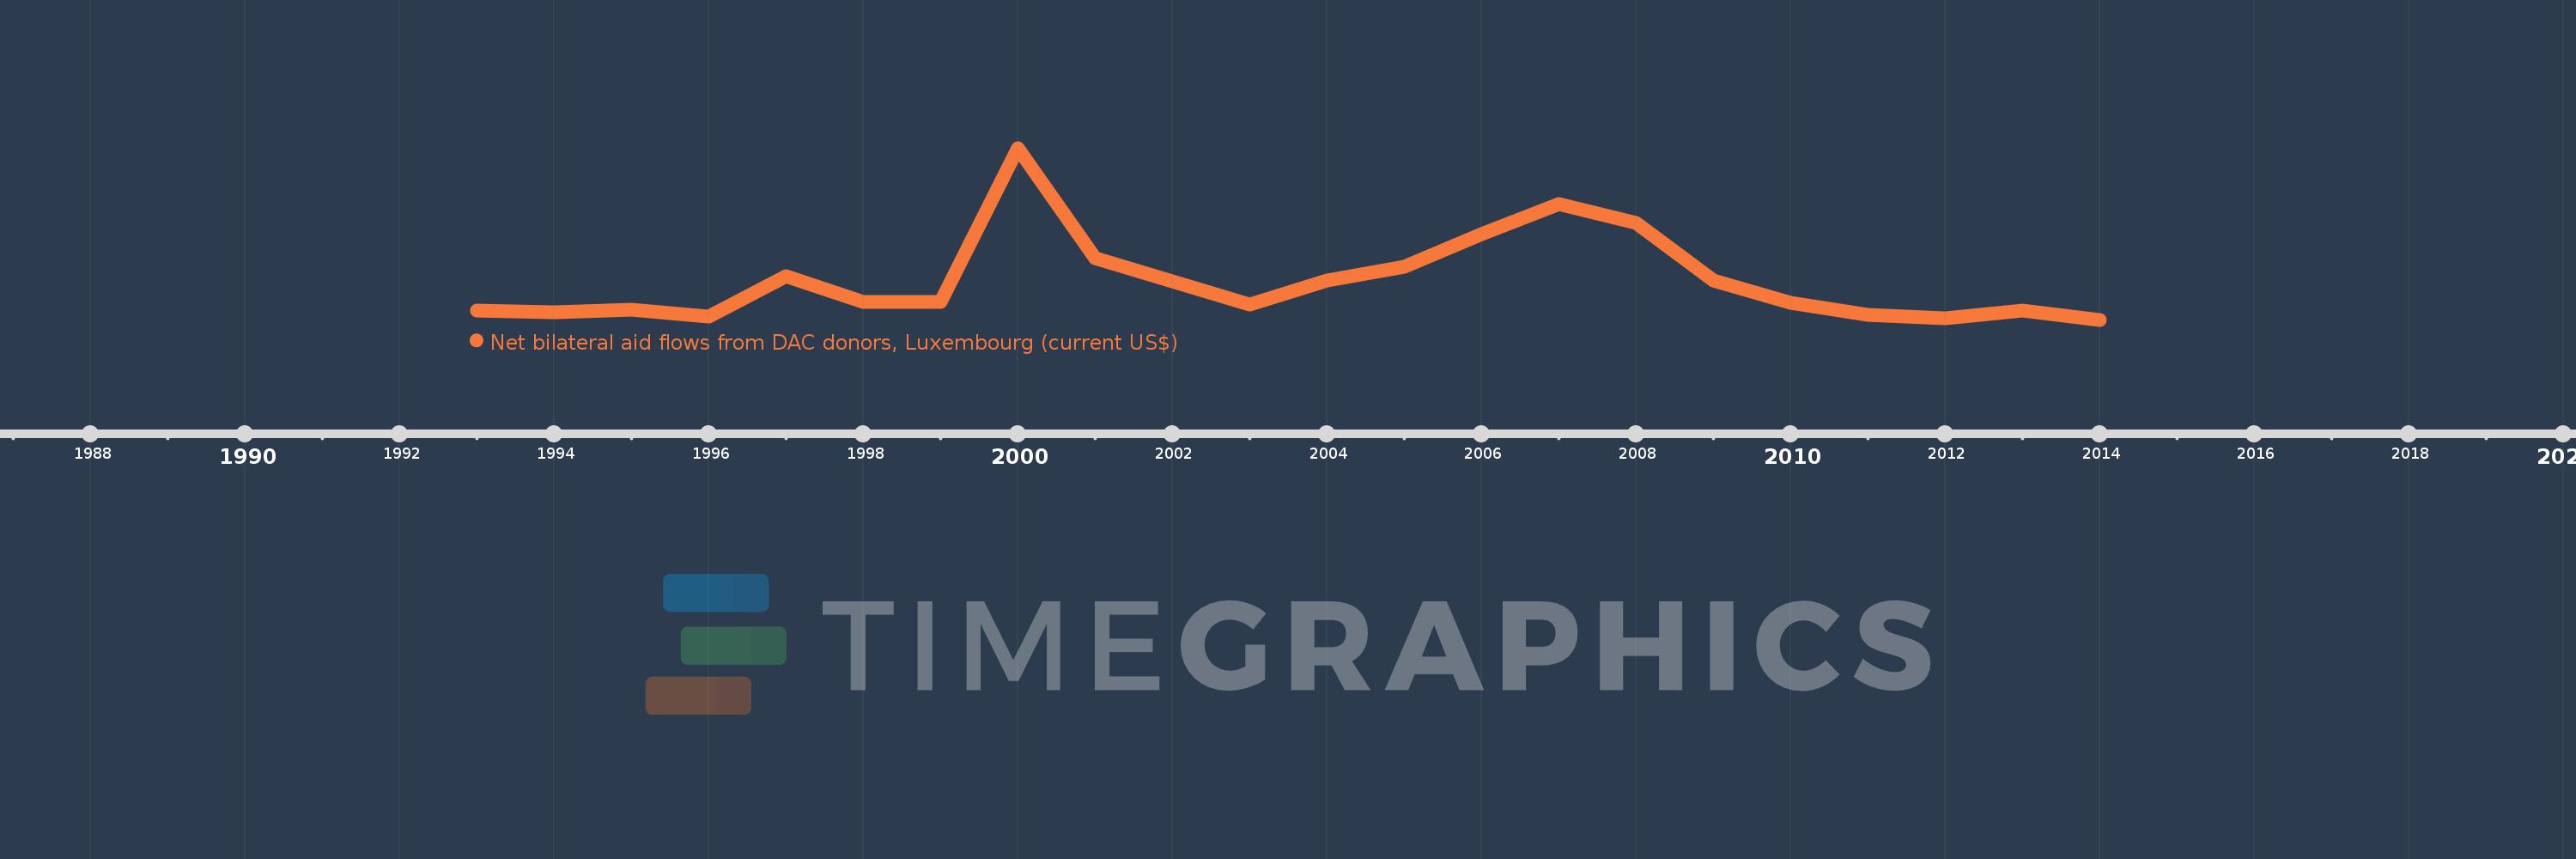
This timeline shows a graph from 1993 to 2014 of Albania. No data until 1992. Number of actual observations by date: 21.
Source name:
World Development Indicators
Source organization:
Development Assistance Committee of the Organisation for Economic Co-operation and Development, Geographical Distribution of Financial Flows to Developing Countries, Development Co-operation Report, and International Development Statistics database. Data are available online at: www.oecd.org/dac/stats/idsonline.
Categories, topics:
Aid Effectiveness
Last updated:
apr 23, 2017
Indicators value changes by year
Meaning:
675.714K
Minimum:
10.0K
jan 1, 2014
Maximum:
2.94 mln
jan 1, 2000
At the date of observation
Value
Absolute change
Change from the previous value
jan 1, 1993
160.0K
+160.0K
0.0%
jan 1, 1994
140.0K
-20.0K
-12.5%
jan 1, 1995
180.0K
+40.0K
28.57%
jan 1, 1996
70.0K
-110.0K
-61.11%
jan 1, 1997
750.0K
+680.0K
971.43%
jan 1, 1998
310.0K
-440.0K
-58.67%
jan 1, 1999
310.0K
0.0
0.0%
jan 1, 2000
2.94 mln
+2.63 mln
848.39%
jan 1, 2001
1.06 mln
-1.88 mln
-63.95%
jan 1, 2003
270.0K
-790.0K
-74.53%
jan 1, 2004
680.0K
+410.0K
151.85%
jan 1, 2005
920.0K
+240.0K
35.29%
jan 1, 2006
1.47 mln
+550.0K
59.78%
jan 1, 2007
1.99 mln
+520.0K
35.37%
jan 1, 2008
1.66 mln
-330.0K
-16.58%
jan 1, 2009
680.0K
-980.0K
-59.04%
jan 1, 2010
300.0K
-380.0K
-55.88%
jan 1, 2011
90.0K
-210.0K
-70.0%
jan 1, 2012
40.0K
-50.0K
-55.56%
jan 1, 2013
160.0K
+120.0K
300.0%
jan 1, 2014
10.0K
-150.0K
-93.75%
Ranking of countries by current statistics by years