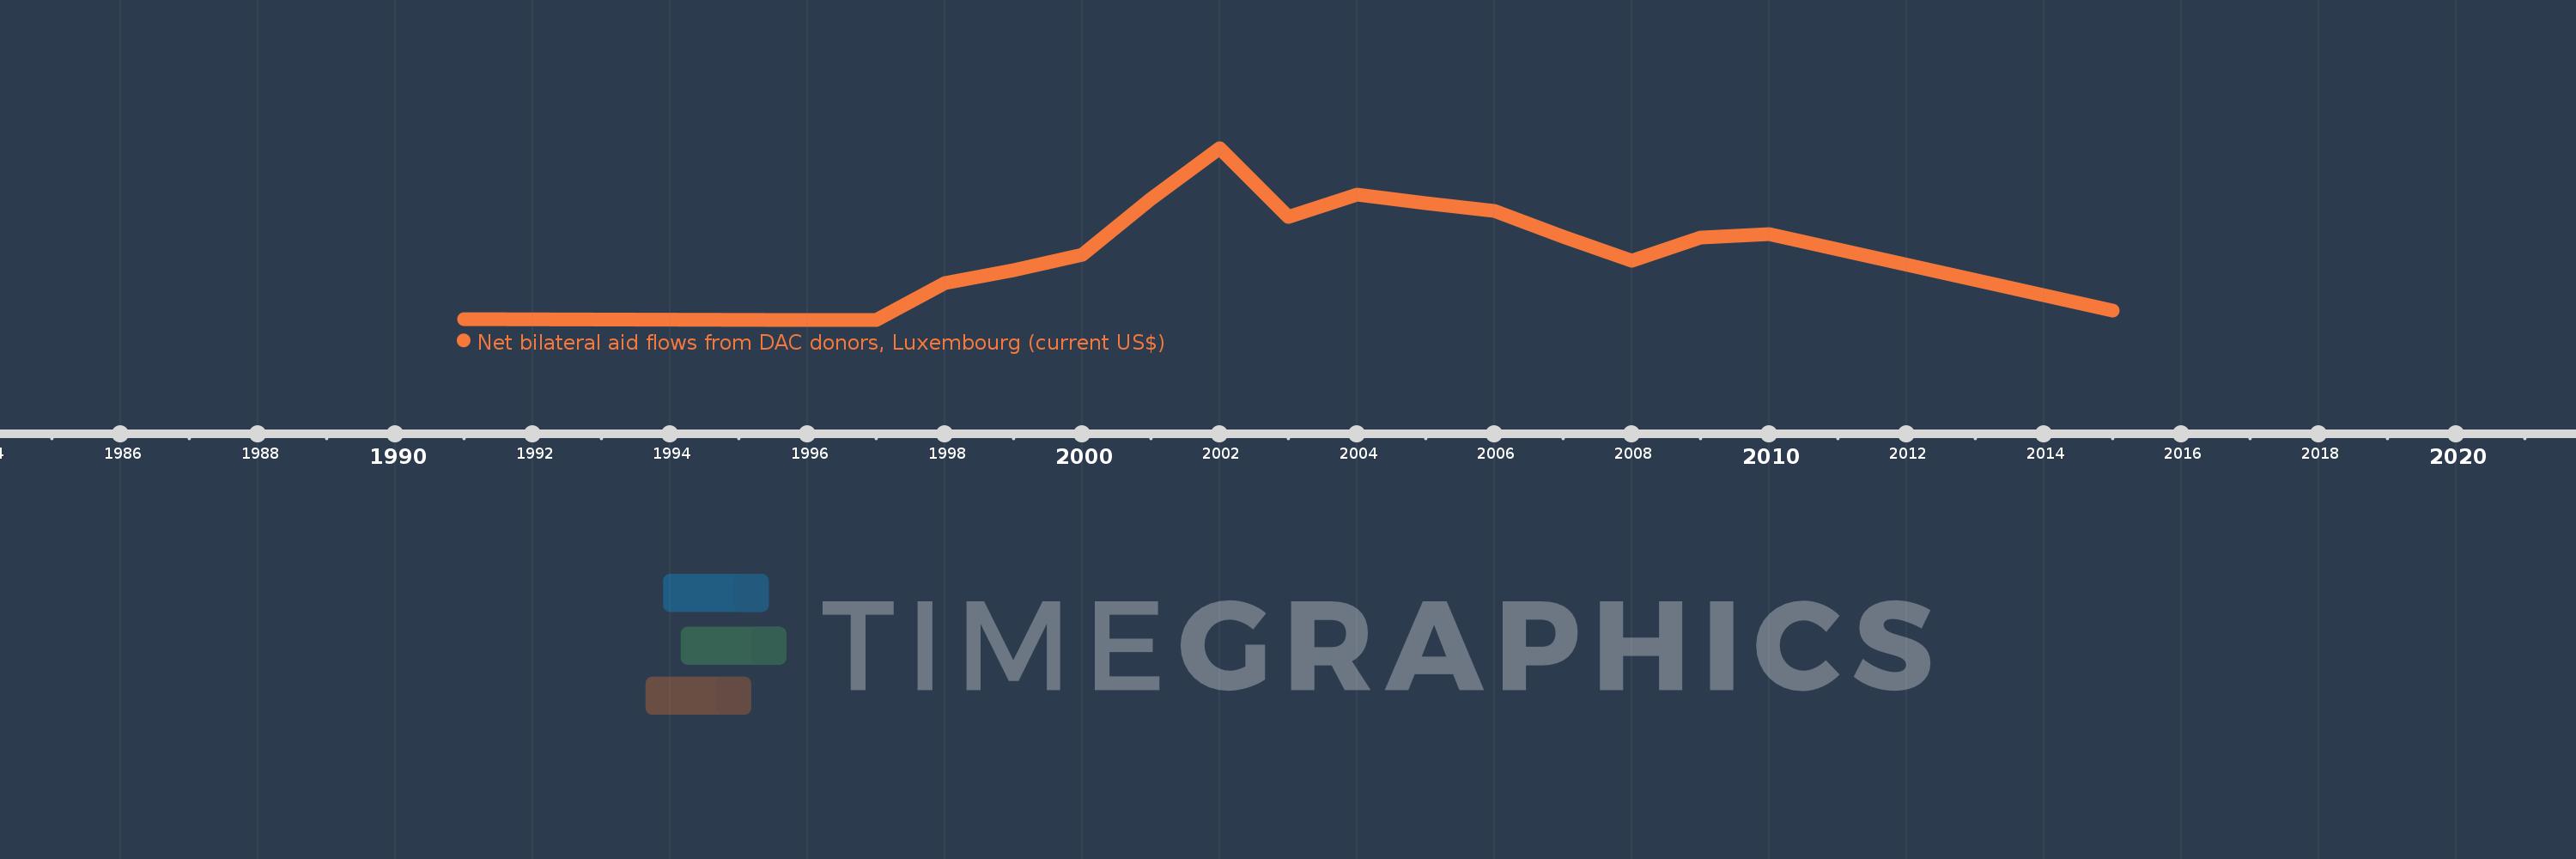
This timeline shows a graph from 1991 to 2015 of Morocco. No data until 1990. Number of actual observations by date: 17.
Source name:
World Development Indicators
Source organization:
Development Assistance Committee of the Organisation for Economic Co-operation and Development, Geographical Distribution of Financial Flows to Developing Countries, Development Co-operation Report, and International Development Statistics database. Data are available online at: www.oecd.org/dac/stats/idsonline.
Categories, topics:
Aid Effectiveness
Last updated:
apr 23, 2017
Indicators value changes by year
Meaning:
1.166 mln
Minimum:
20.0K
jan 1, 1996
Maximum:
2.77 mln
jan 1, 2002
At the date of observation
Value
Absolute change
Change from the previous value
jan 1, 1991
30.0K
+30.0K
0.0%
jan 1, 1996
20.0K
-10.0K
-33.33%
jan 1, 1997
20.0K
0.0
0.0%
jan 1, 1998
610.0K
+590.0K
2.95K%
jan 1, 1999
810.0K
+200.0K
32.79%
jan 1, 2000
1.06 mln
+250.0K
30.86%
jan 1, 2001
1.95 mln
+890.0K
83.96%
jan 1, 2002
2.77 mln
+820.0K
42.05%
jan 1, 2003
1.66 mln
-1.11 mln
-40.07%
jan 1, 2004
2.03 mln
+370.0K
22.29%
jan 1, 2005
1.89 mln
-140.0K
-6.9%
jan 1, 2006
1.76 mln
-130.0K
-6.88%
jan 1, 2007
1.35 mln
-410.0K
-23.3%
jan 1, 2008
970.0K
-380.0K
-28.15%
jan 1, 2009
1.34 mln
+370.0K
38.14%
jan 1, 2010
1.39 mln
+50.0K
3.73%
jan 1, 2015
170.0K
-1.22 mln
-87.77%
Ranking of countries by current statistics by years