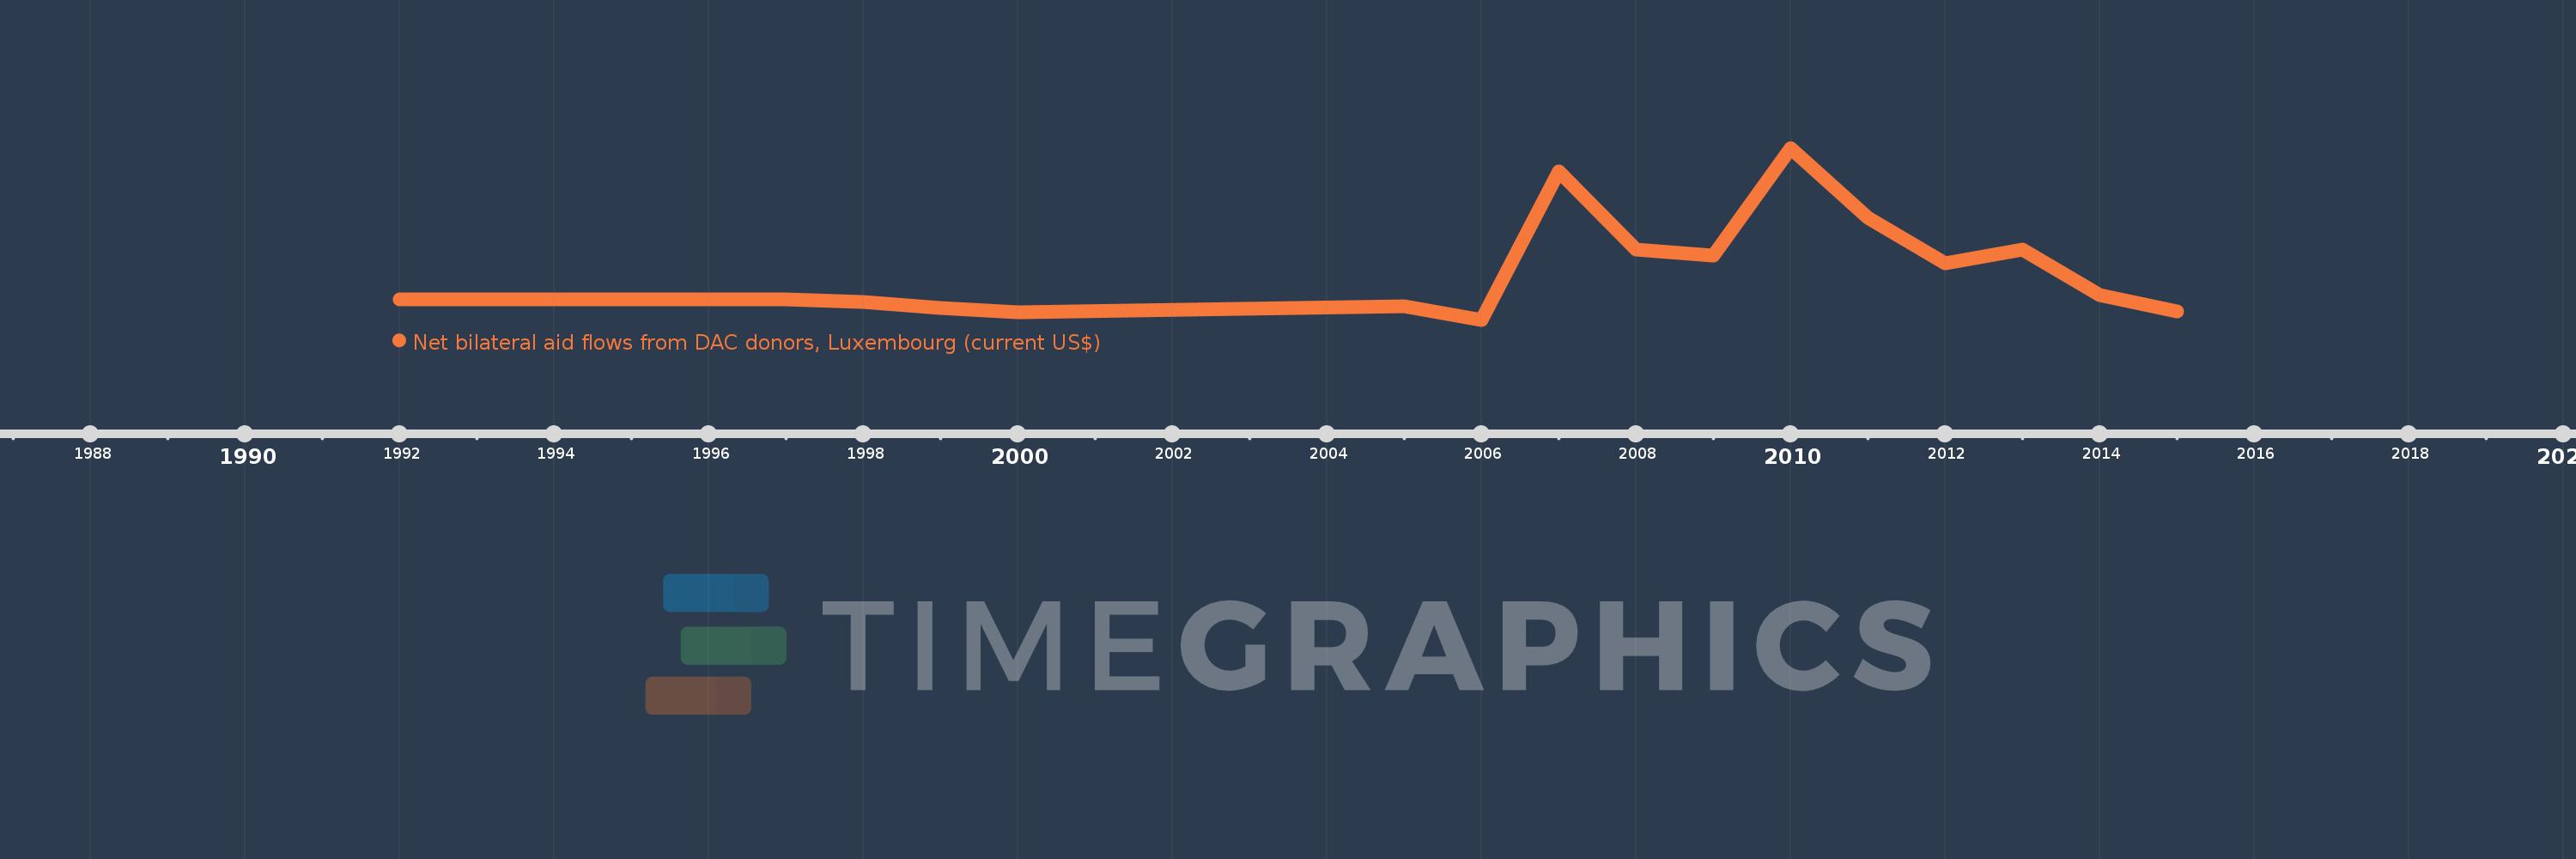
This timeline shows a graph from 1992 to 2015 of Sri Lanka. No data until 1991. Number of actual observations by date: 16.
Source name:
World Development Indicators
Source organization:
Development Assistance Committee of the Organisation for Economic Co-operation and Development, Geographical Distribution of Financial Flows to Developing Countries, Development Co-operation Report, and International Development Statistics database. Data are available online at: www.oecd.org/dac/stats/idsonline.
Categories, topics:
Aid Effectiveness
Last updated:
apr 23, 2017
Indicators value changes by year
Meaning:
366.25K
Minimum:
20.0K
jan 1, 2006
Maximum:
1.2 mln
jan 1, 2010
At the date of observation
Value
Absolute change
Change from the previous value
jan 1, 1992
160.0K
+160.0K
0.0%
jan 1, 1997
160.0K
0.0
0.0%
jan 1, 1998
140.0K
-20.0K
-12.5%
jan 1, 1999
100.0K
-40.0K
-28.57%
jan 1, 2000
70.0K
-30.0K
-30.0%
jan 1, 2005
110.0K
+40.0K
57.14%
jan 1, 2006
20.0K
-90.0K
-81.82%
jan 1, 2007
1.04 mln
+1.02 mln
5.1K%
jan 1, 2008
500.0K
-540.0K
-51.92%
jan 1, 2009
460.0K
-40.0K
-8.0%
jan 1, 2010
1.2 mln
+740.0K
160.87%
jan 1, 2011
720.0K
-480.0K
-40.0%
jan 1, 2012
410.0K
-310.0K
-43.06%
jan 1, 2013
500.0K
+90.0K
21.95%
jan 1, 2014
190.0K
-310.0K
-62.0%
jan 1, 2015
80.0K
-110.0K
-57.89%
Ranking of countries by current statistics by years