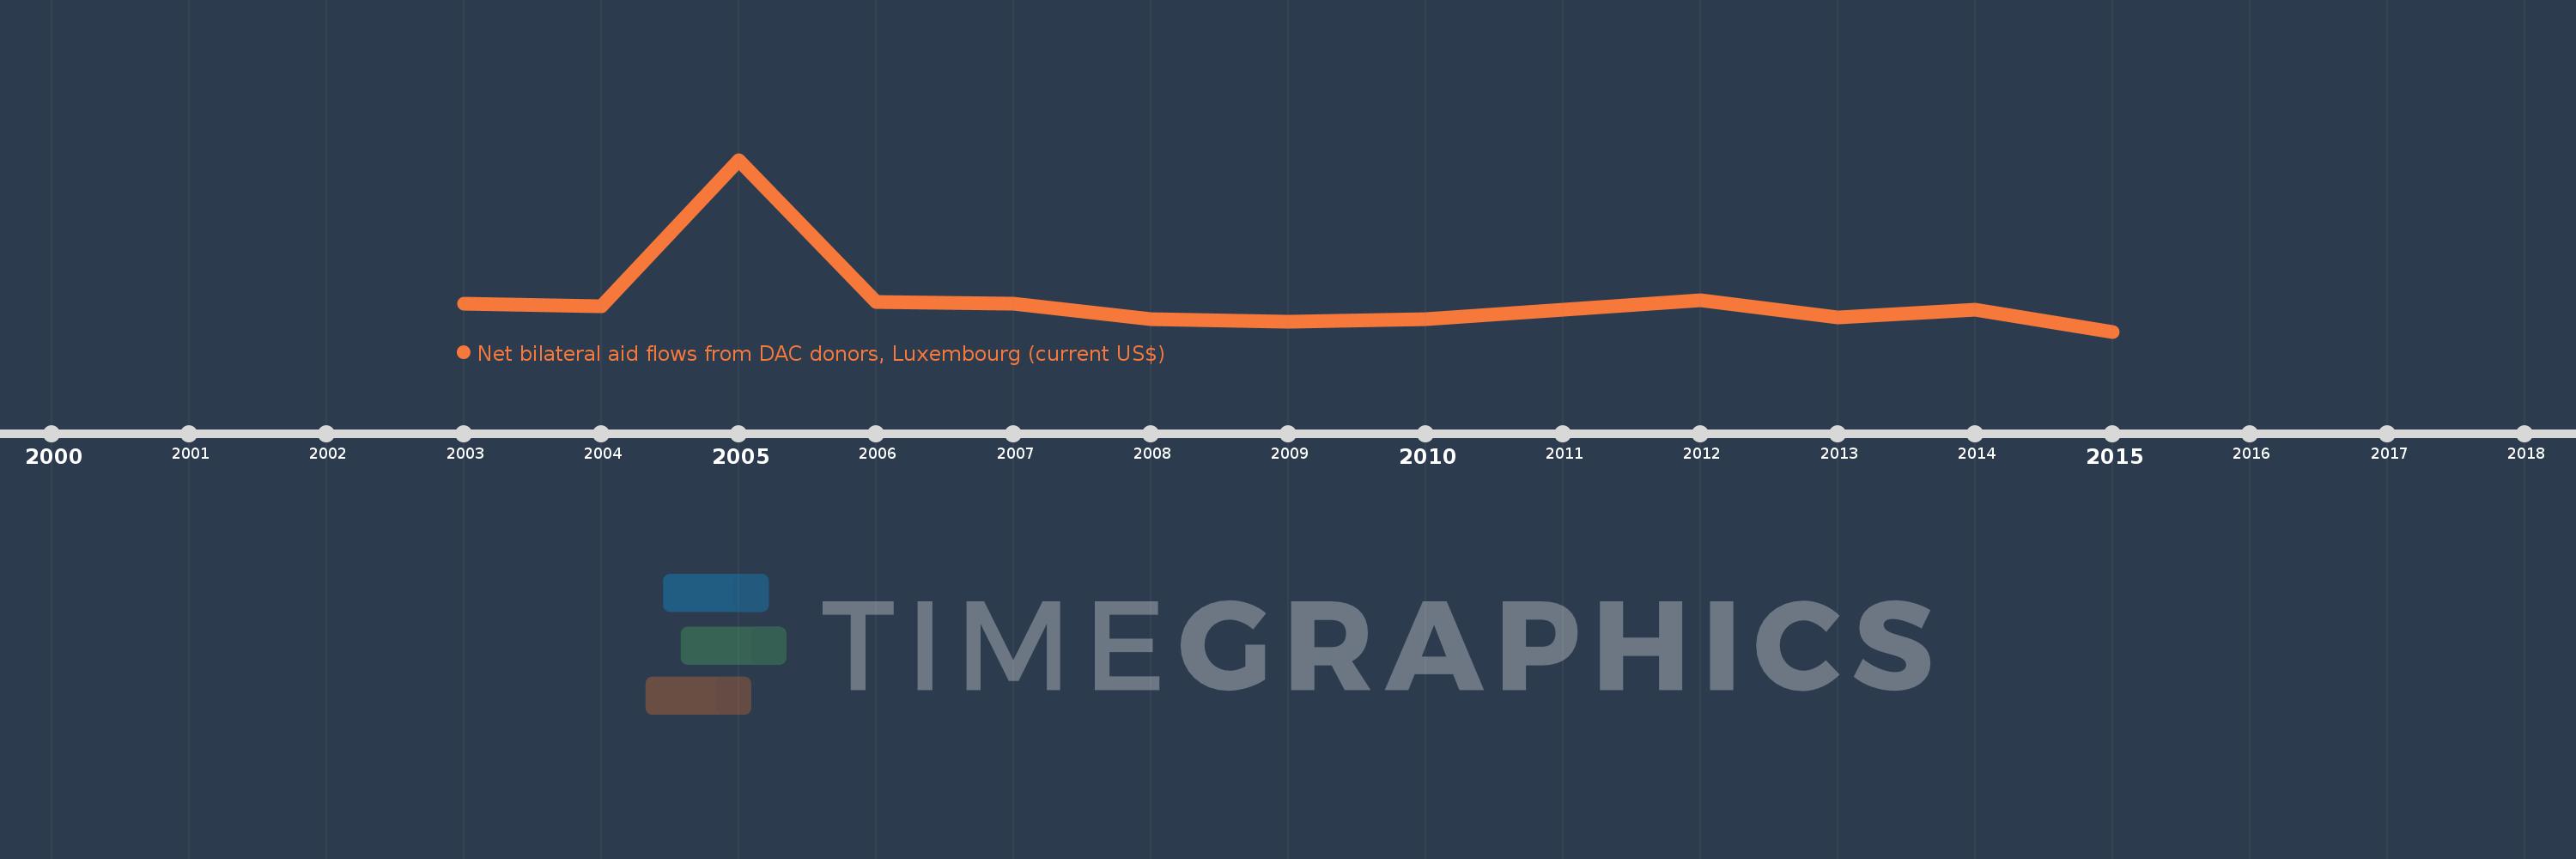
This timeline shows a graph from 2003 to 2015 of Korea, Dem. People’s Rep.. No data until 2002. Number of actual observations by date: 12.
Source name:
World Development Indicators
Source organization:
Development Assistance Committee of the Organisation for Economic Co-operation and Development, Geographical Distribution of Financial Flows to Developing Countries, Development Co-operation Report, and International Development Statistics database. Data are available online at: www.oecd.org/dac/stats/idsonline.
Categories, topics:
Aid Effectiveness
Last updated:
apr 23, 2017
Indicators value changes by year
Meaning:
708.333K
Minimum:
110.0K
jan 1, 2015
Maximum:
3.31 mln
jan 1, 2005
At the date of observation
Value
Absolute change
Change from the previous value
jan 1, 2003
630.0K
+630.0K
0.0%
jan 1, 2004
590.0K
-40.0K
-6.35%
jan 1, 2005
3.31 mln
+2.72 mln
461.02%
jan 1, 2006
660.0K
-2.65 mln
-80.06%
jan 1, 2007
630.0K
-30.0K
-4.55%
jan 1, 2008
340.0K
-290.0K
-46.03%
jan 1, 2009
290.0K
-50.0K
-14.71%
jan 1, 2010
350.0K
+60.0K
20.69%
jan 1, 2012
700.0K
+350.0K
100.0%
jan 1, 2013
370.0K
-330.0K
-47.14%
jan 1, 2014
520.0K
+150.0K
40.54%
jan 1, 2015
110.0K
-410.0K
-78.85%
Ranking of countries by current statistics by years