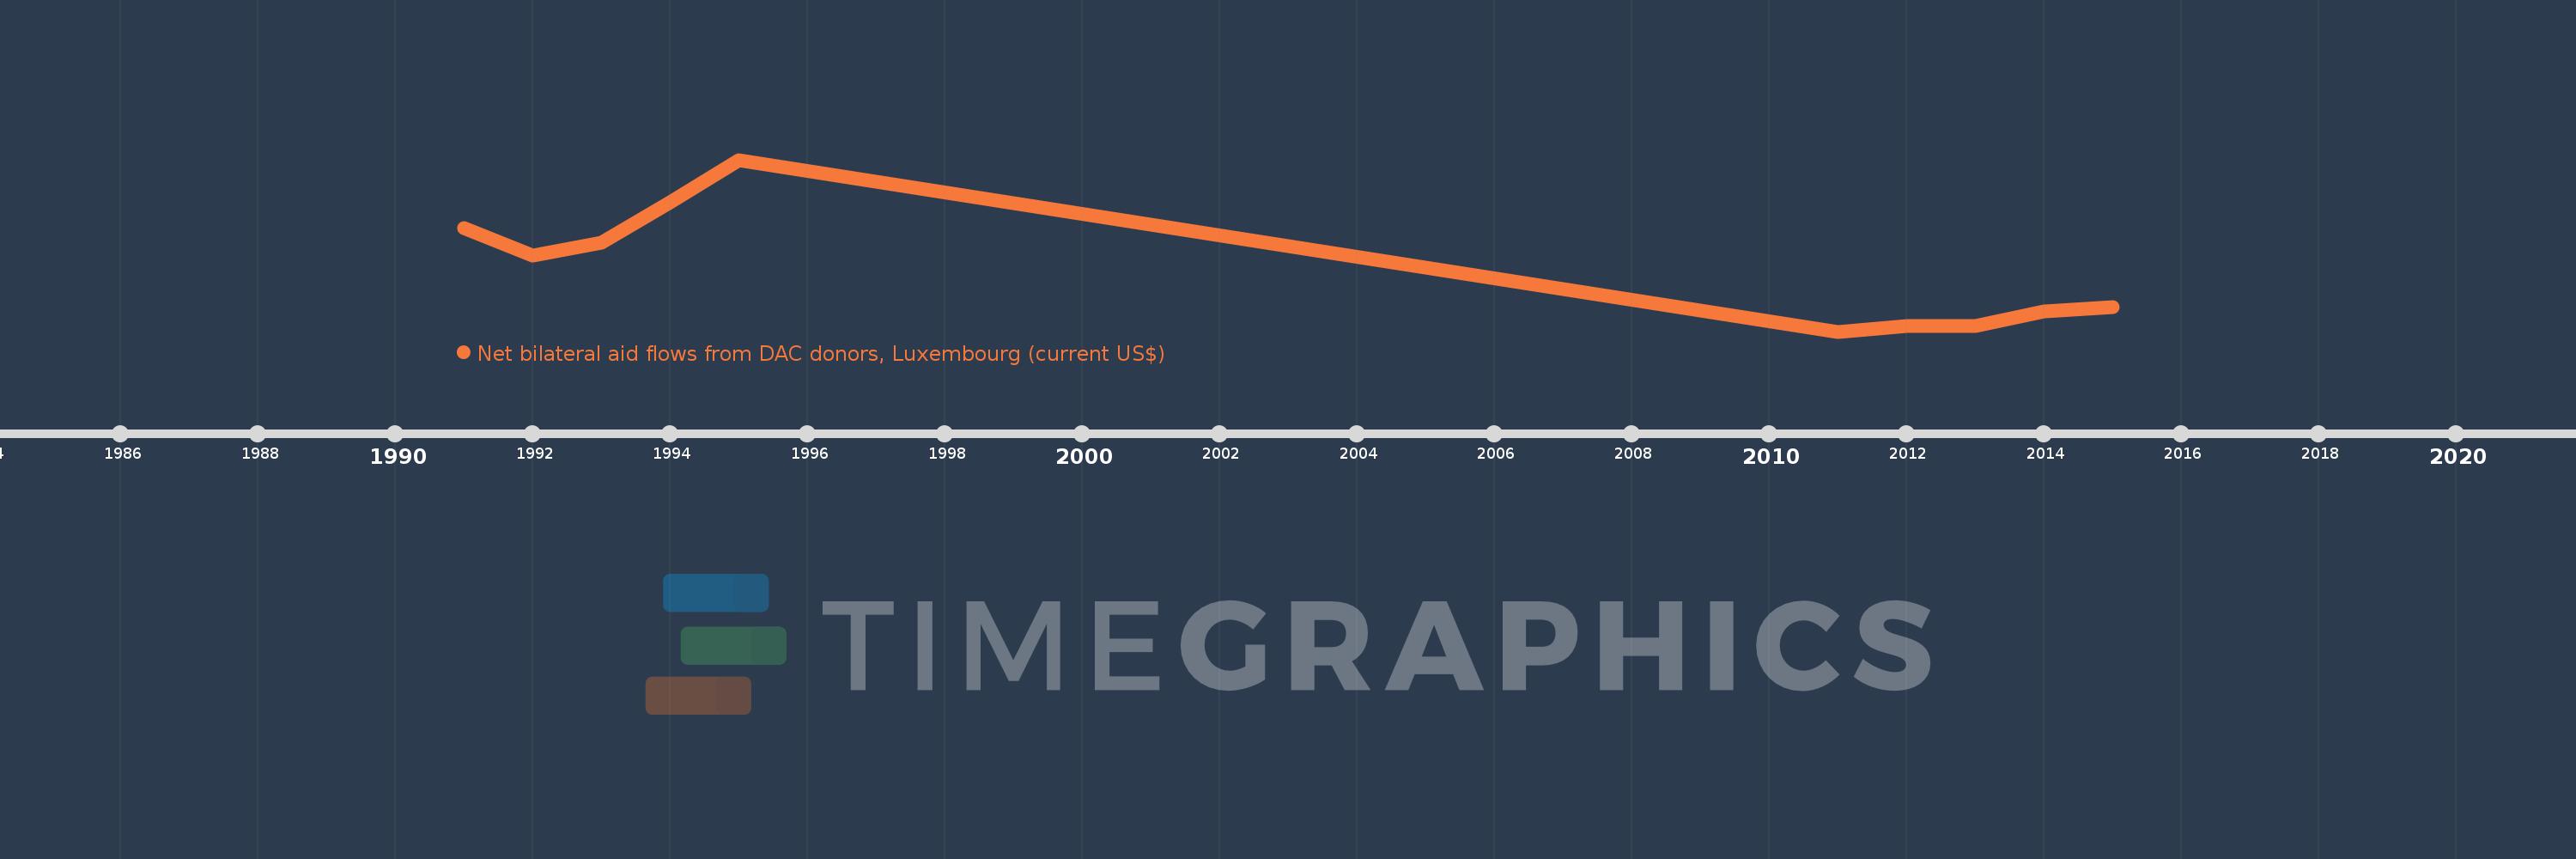
This timeline shows a graph from 1991 to 2015 of Gambia, The. No data until 1990. Number of actual observations by date: 10.
Source name:
World Development Indicators
Source organization:
Development Assistance Committee of the Organisation for Economic Co-operation and Development, Geographical Distribution of Financial Flows to Developing Countries, Development Co-operation Report, and International Development Statistics database. Data are available online at: www.oecd.org/dac/stats/idsonline.
Categories, topics:
Aid Effectiveness
Last updated:
apr 23, 2017
Indicators value changes by year
Meaning:
550.0K
Minimum:
120.0K
jan 1, 2011
Maximum:
1.3 mln
jan 1, 1995
At the date of observation
Value
Absolute change
Change from the previous value
jan 1, 1991
830.0K
+830.0K
0.0%
jan 1, 1992
640.0K
-190.0K
-22.89%
jan 1, 1993
730.0K
+90.0K
14.06%
jan 1, 1994
1.01 mln
+280.0K
38.36%
jan 1, 1995
1.3 mln
+290.0K
28.71%
jan 1, 2011
120.0K
-1.18 mln
-90.77%
jan 1, 2012
160.0K
+40.0K
33.33%
jan 1, 2013
160.0K
0.0
0.0%
jan 1, 2014
260.0K
+100.0K
62.5%
jan 1, 2015
290.0K
+30.0K
11.54%
Ranking of countries by current statistics by years