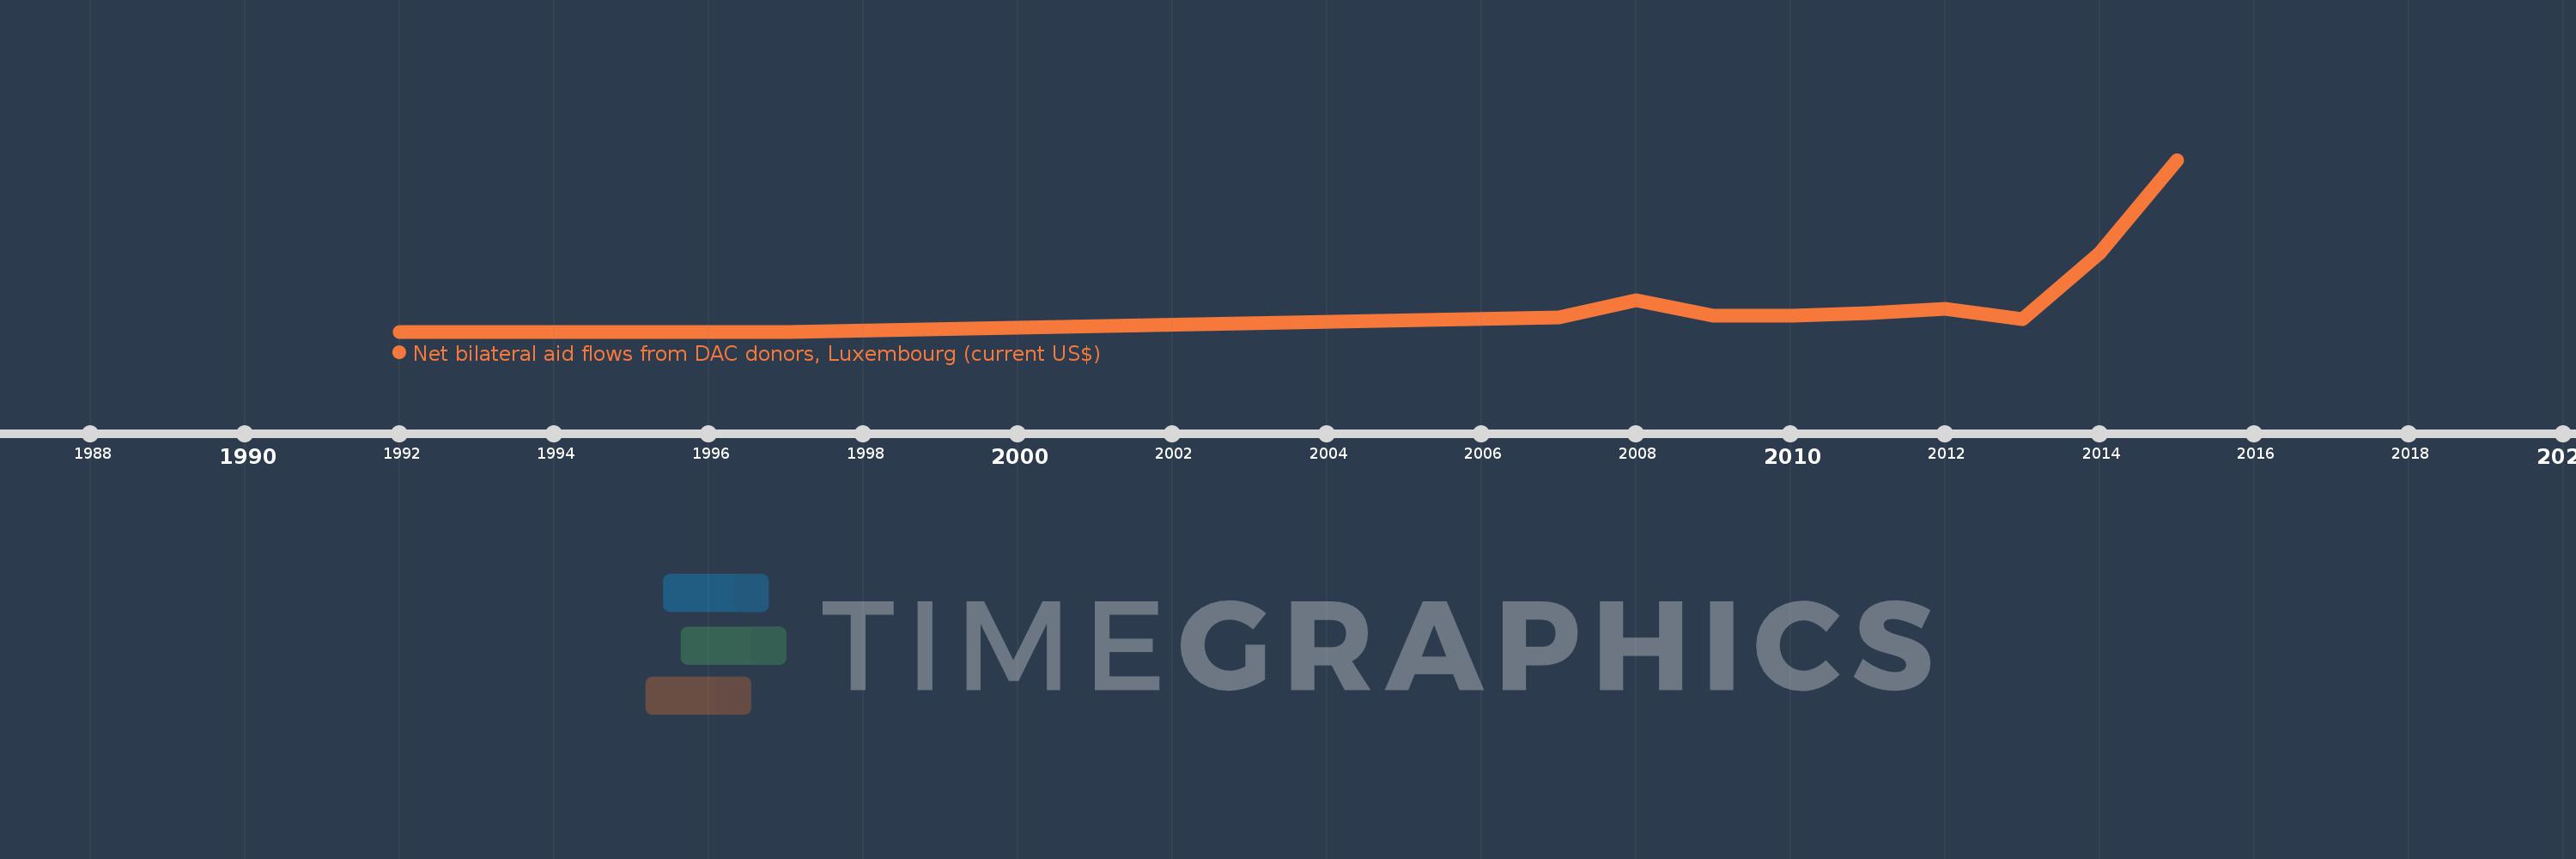
This timeline shows a graph from 1992 to 2015 of Central African Republic. No data until 1991. Number of actual observations by date: 11.
Source name:
World Development Indicators
Source organization:
Development Assistance Committee of the Organisation for Economic Co-operation and Development, Geographical Distribution of Financial Flows to Developing Countries, Development Co-operation Report, and International Development Statistics database. Data are available online at: www.oecd.org/dac/stats/idsonline.
Categories, topics:
Aid Effectiveness
Last updated:
apr 23, 2017
Indicators value changes by year
Meaning:
756.364K
Minimum:
10.0K
jan 1, 1992
Maximum:
3.72 mln
jan 1, 2015
At the date of observation
Value
Absolute change
Change from the previous value
jan 1, 1992
10.0K
+10.0K
0.0%
jan 1, 1997
10.0K
0.0
0.0%
jan 1, 2007
310.0K
+300.0K
3.0K%
jan 1, 2008
680.0K
+370.0K
119.35%
jan 1, 2009
360.0K
-320.0K
-47.06%
jan 1, 2010
350.0K
-10.0K
-2.78%
jan 1, 2011
410.0K
+60.0K
17.14%
jan 1, 2012
500.0K
+90.0K
21.95%
jan 1, 2013
270.0K
-230.0K
-46.0%
jan 1, 2014
1.7 mln
+1.43 mln
529.63%
jan 1, 2015
3.72 mln
+2.02 mln
118.82%
Ranking of countries by current statistics by years