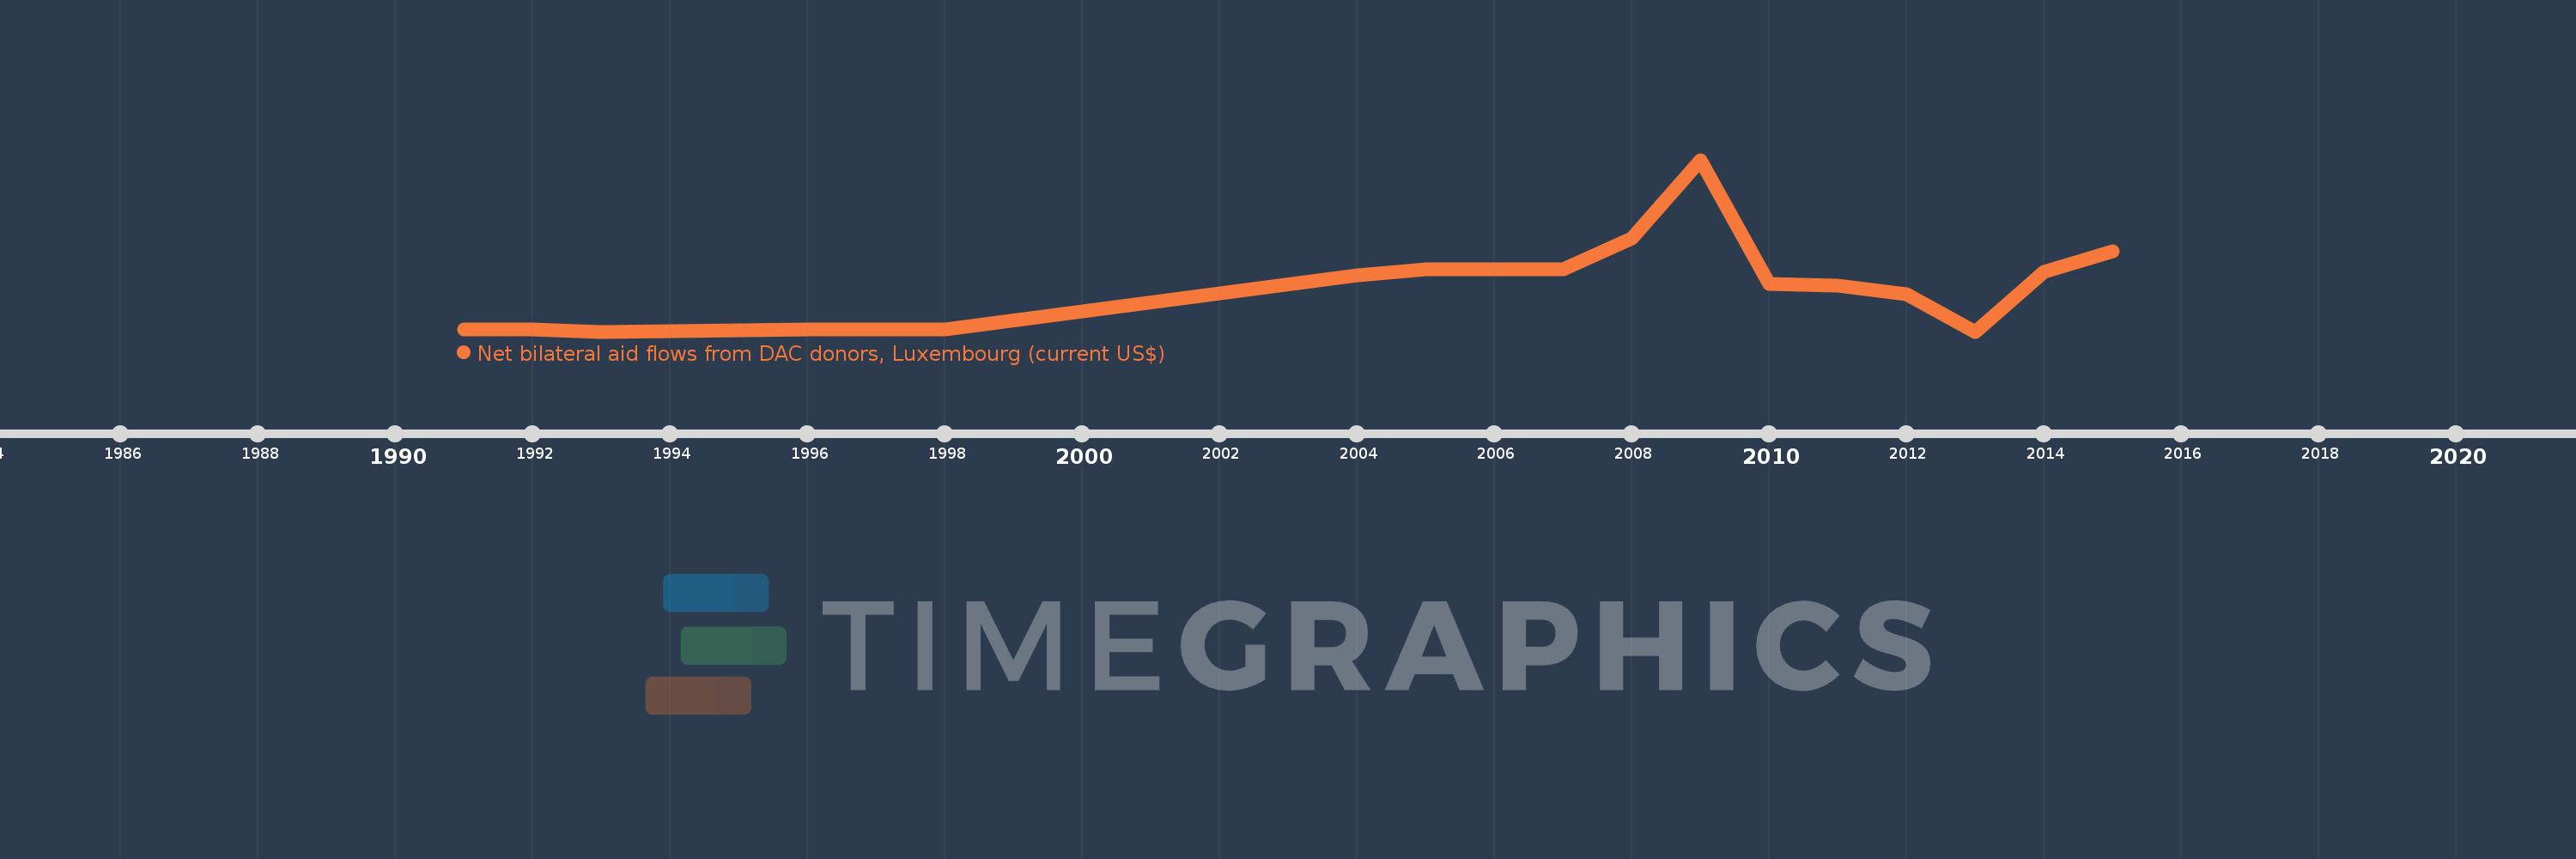
This timeline shows a graph from 1991 to 2015 of Myanmar. No data until 1990. Number of actual observations by date: 17.
Source name:
World Development Indicators
Source organization:
Development Assistance Committee of the Organisation for Economic Co-operation and Development, Geographical Distribution of Financial Flows to Developing Countries, Development Co-operation Report, and International Development Statistics database. Data are available online at: www.oecd.org/dac/stats/idsonline.
Categories, topics:
Aid Effectiveness
Last updated:
apr 23, 2017
Indicators value changes by year
Meaning:
233.529K
Minimum:
10.0K
jan 1, 1993
Maximum:
840.0K
jan 1, 2009
At the date of observation
Value
Absolute change
Change from the previous value
jan 1, 1991
20.0K
+20.0K
0.0%
jan 1, 1992
20.0K
0.0
0.0%
jan 1, 1993
10.0K
-10.0K
-50.0%
jan 1, 1996
20.0K
+10.0K
100.0%
jan 1, 1998
20.0K
0.0
0.0%
jan 1, 2004
280.0K
+260.0K
1.3K%
jan 1, 2005
310.0K
+30.0K
10.71%
jan 1, 2006
310.0K
0.0
0.0%
jan 1, 2007
310.0K
0.0
0.0%
jan 1, 2008
460.0K
+150.0K
48.39%
jan 1, 2009
840.0K
+380.0K
82.61%
jan 1, 2010
240.0K
-600.0K
-71.43%
jan 1, 2011
230.0K
-10.0K
-4.17%
jan 1, 2012
190.0K
-40.0K
-17.39%
jan 1, 2013
10.0K
-180.0K
-94.74%
jan 1, 2014
300.0K
+290.0K
2.9K%
jan 1, 2015
400.0K
+100.0K
33.33%
Ranking of countries by current statistics by years