33
/
AIzaSyB4mHJ5NPEv-XzF7P6NDYXjlkCWaeKw5bc
November 30, 2025
33677
European Union
EUU
false
2
1
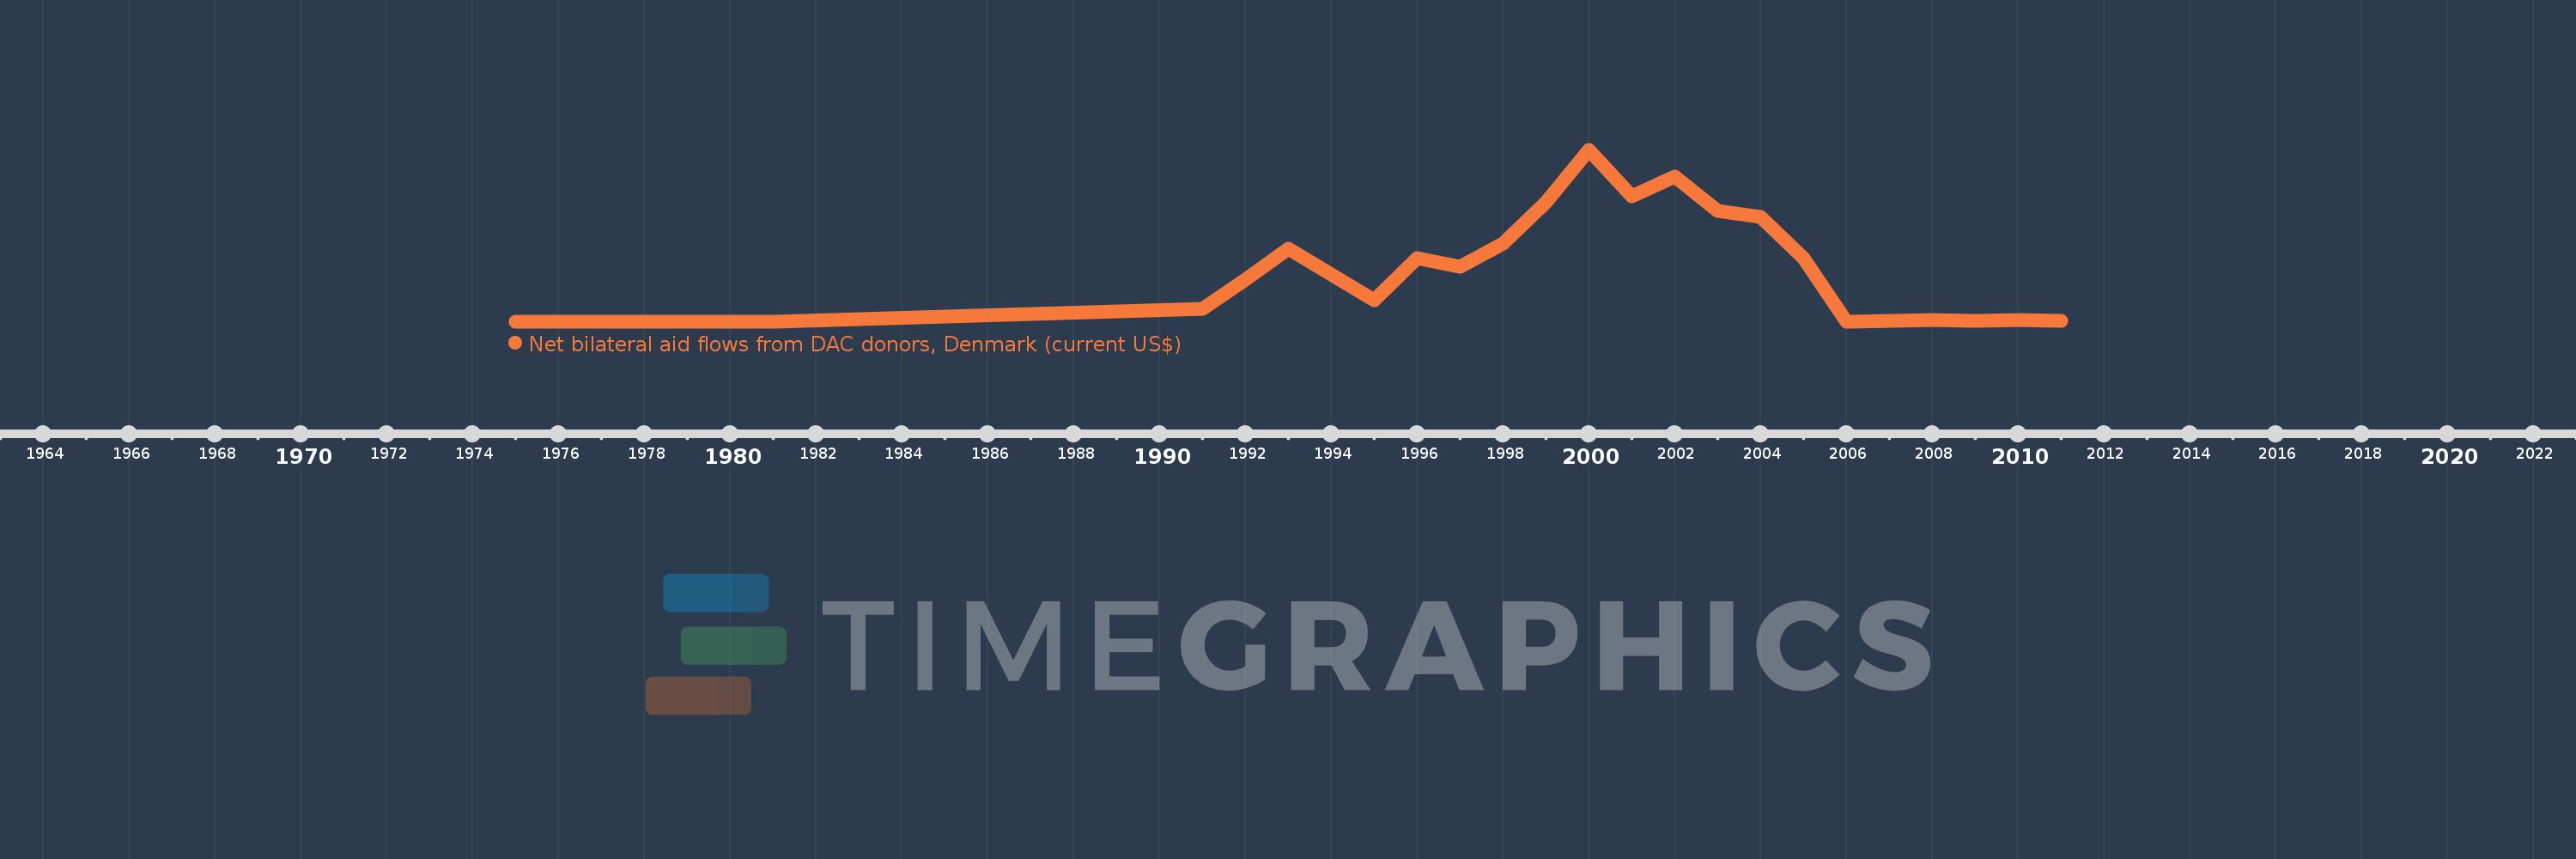
Net bilateral aid flows from DAC donors, Denmark (current US$)
2011,2010,2009,2008,2007,2006,2005,2004,2003,2002,2001,2000,1999,1998,1997,1996,1995,1993,1992,1991,1981,1980,1978,1977,1976,1975