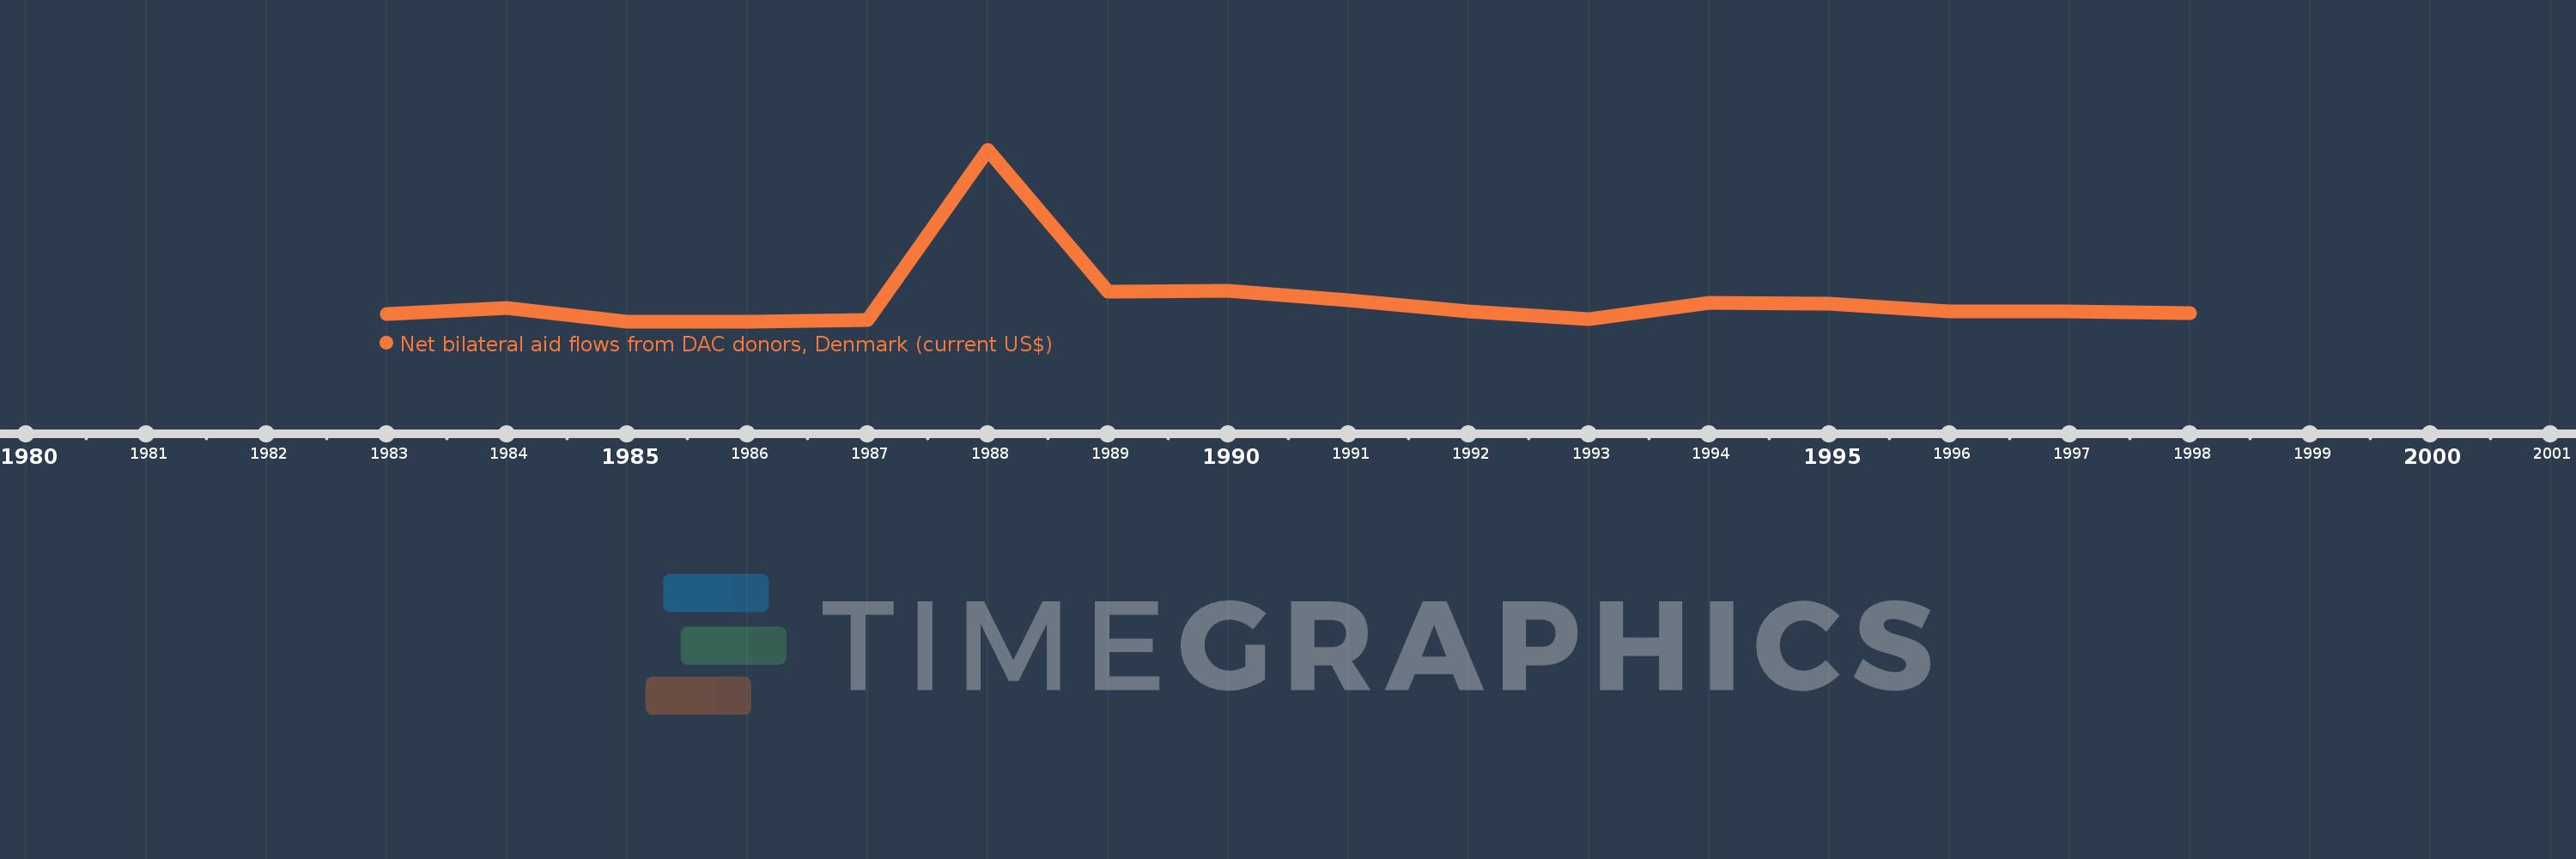
This timeline shows a graph from 1983 to 1998 of Mauritania. No data until 1982. Number of actual observations by date: 16.
Source name:
World Development Indicators
Source organization:
Development Assistance Committee of the Organisation for Economic Co-operation and Development, Geographical Distribution of Financial Flows to Developing Countries, Development Co-operation Report, and International Development Statistics database. Data are available online at: www.oecd.org/dac/stats/idsonline.
Categories, topics:
Aid Effectiveness
Last updated:
apr 23, 2017
Indicators value changes by year
Meaning:
1.711 mln
Minimum:
380.0K
jan 1, 1985
Maximum:
10.56 mln
jan 1, 1988
At the date of observation
Value
Absolute change
Change from the previous value
jan 1, 1983
830.0K
+830.0K
0.0%
jan 1, 1984
1.21 mln
+380.0K
45.78%
jan 1, 1985
380.0K
-830.0K
-68.6%
jan 1, 1986
400.0K
+20.0K
5.26%
jan 1, 1987
490.0K
+90.0K
22.5%
jan 1, 1988
10.56 mln
+10.07 mln
2.06K%
jan 1, 1989
2.19 mln
-8.37 mln
-79.26%
jan 1, 1990
2.22 mln
+30.0K
1.37%
jan 1, 1991
1.66 mln
-560.0K
-25.23%
jan 1, 1992
1.02 mln
-640.0K
-38.55%
jan 1, 1993
550.0K
-470.0K
-46.08%
jan 1, 1994
1.49 mln
+940.0K
170.91%
jan 1, 1995
1.44 mln
-50.0K
-3.36%
jan 1, 1996
1.01 mln
-430.0K
-29.86%
jan 1, 1997
1000.0K
-10.0K
-0.99%
jan 1, 1998
920.0K
-80.0K
-8.0%
Ranking of countries by current statistics by years