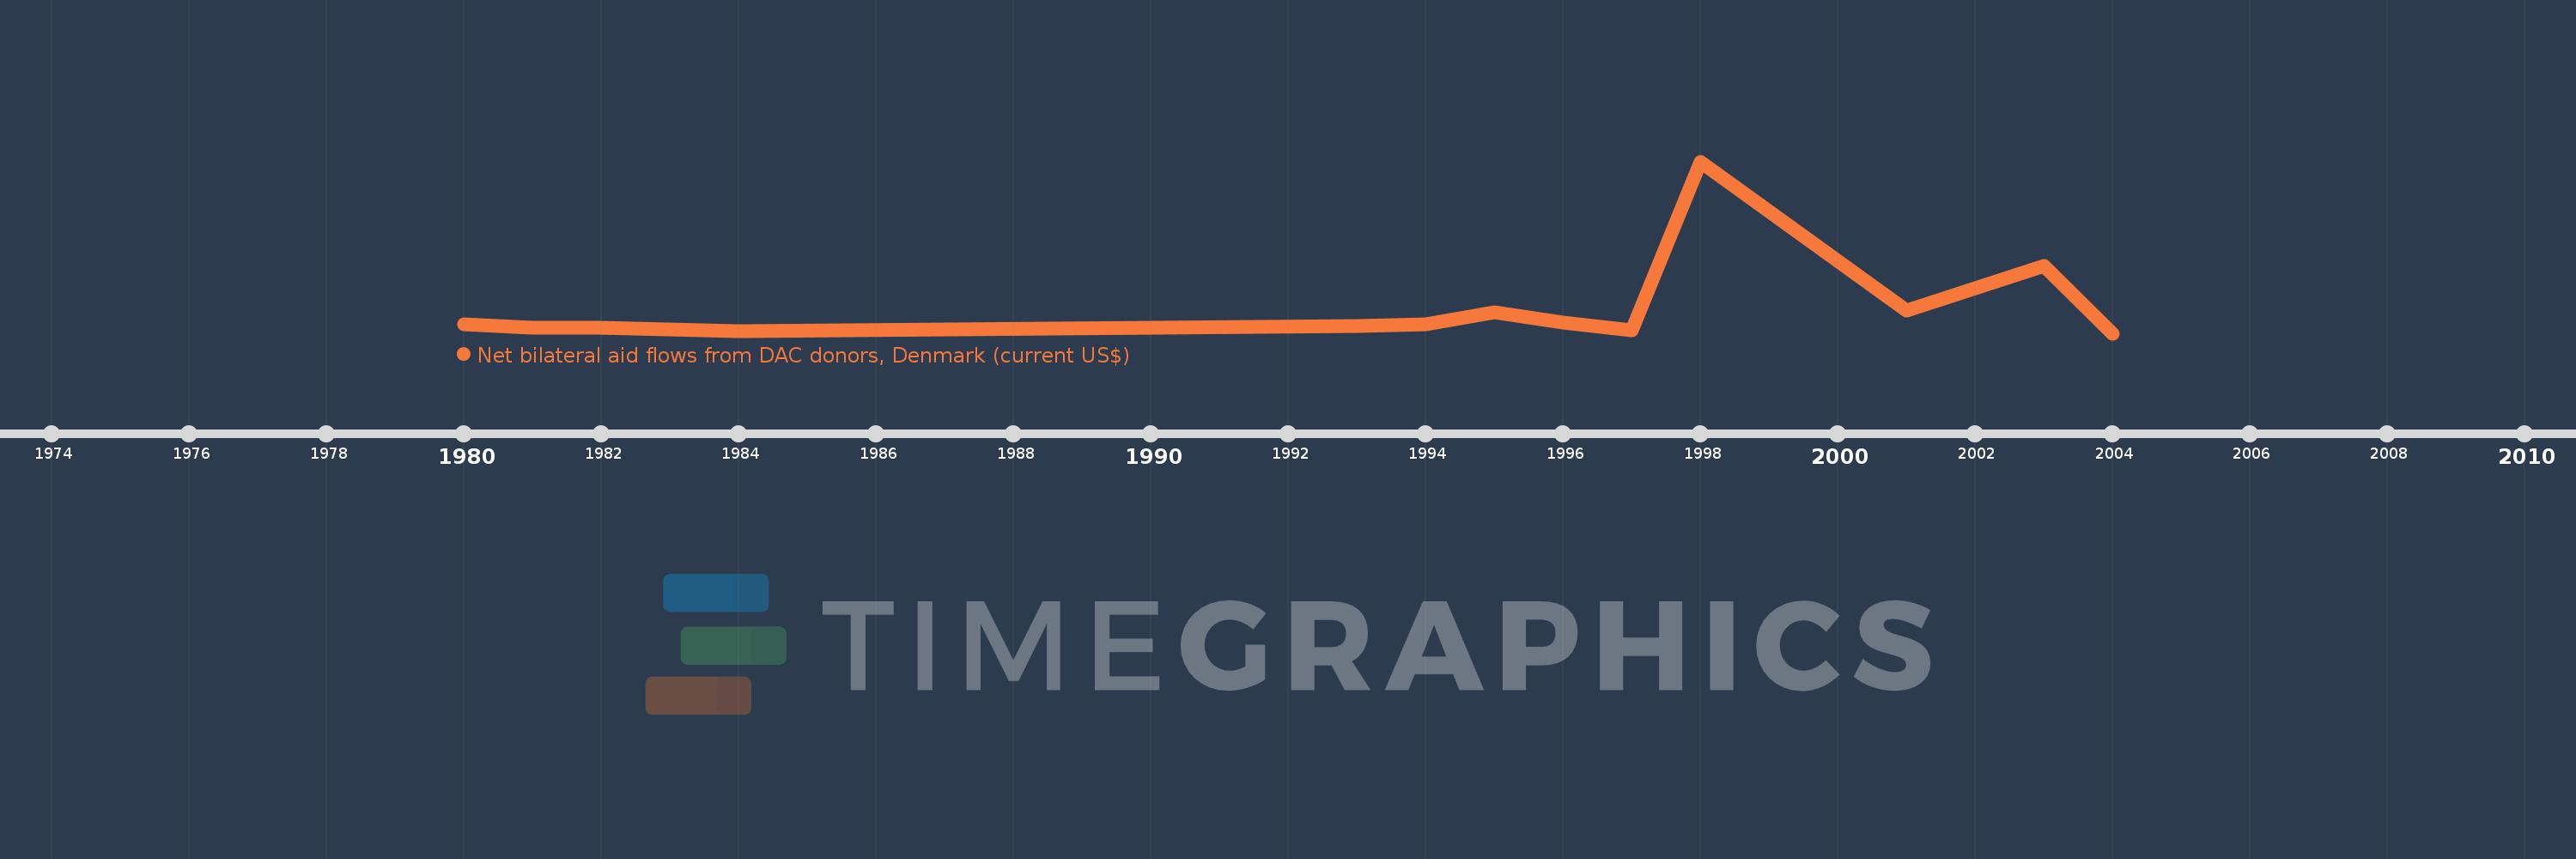
This timeline shows a graph from 1980 to 2004 of Caribbean small states. No data until 1979. Number of actual observations by date: 13.
Source name:
World Development Indicators
Source organization:
Development Assistance Committee of the Organisation for Economic Co-operation and Development, Geographical Distribution of Financial Flows to Developing Countries, Development Co-operation Report, and International Development Statistics database. Data are available online at: www.oecd.org/dac/stats/idsonline.
Categories, topics:
Aid Effectiveness
Last updated:
apr 23, 2017
Indicators value changes by year
Meaning:
428.462K
Minimum:
-10.0K
jan 1, 2004
Maximum:
2.92 mln
jan 1, 1998
At the date of observation
Value
Absolute change
Change from the previous value
jan 1, 1980
150.0K
+150.0K
0.0%
jan 1, 1981
80.0K
-70.0K
-46.67%
jan 1, 1982
80.0K
0.0
0.0%
jan 1, 1984
20.0K
-60.0K
-75.0%
jan 1, 1993
110.0K
+90.0K
450.0%
jan 1, 1994
140.0K
+30.0K
27.27%
jan 1, 1995
350.0K
+210.0K
150.0%
jan 1, 1996
170.0K
-180.0K
-51.43%
jan 1, 1997
40.0K
-130.0K
-76.47%
jan 1, 1998
2.92 mln
+2.88 mln
7.2K%
jan 1, 2001
380.0K
-2.54 mln
-86.99%
jan 1, 2003
1.14 mln
+760.0K
200.0%
jan 1, 2004
-10.0K
-1.15 mln
-100.88%
Ranking of countries by current statistics by years