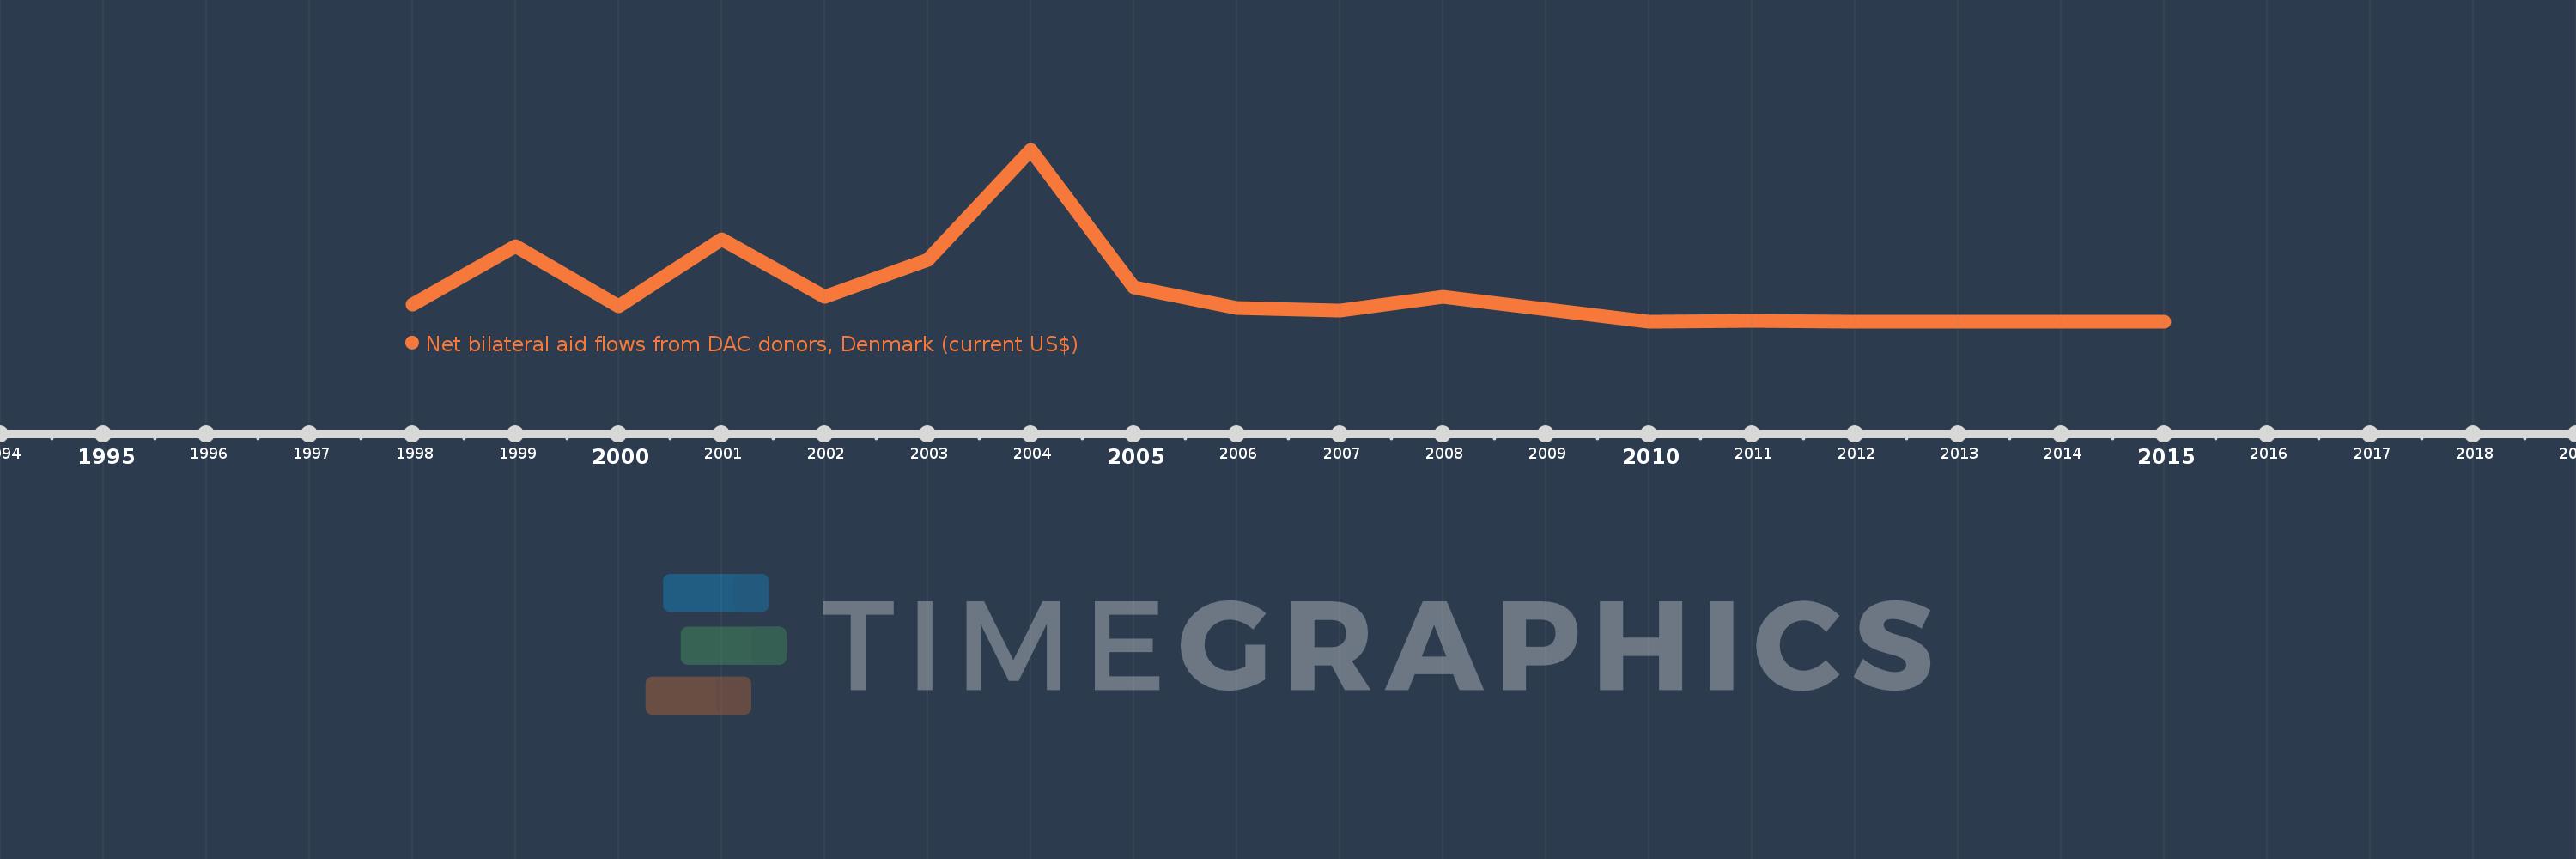
This timeline shows a graph from 1998 to 2015 of Macedonia, FYR. No data until 1997. Number of actual observations by date: 17.
Source name:
World Development Indicators
Source organization:
Development Assistance Committee of the Organisation for Economic Co-operation and Development, Geographical Distribution of Financial Flows to Developing Countries, Development Co-operation Report, and International Development Statistics database. Data are available online at: www.oecd.org/dac/stats/idsonline.
Categories, topics:
Aid Effectiveness
Last updated:
apr 23, 2017
Indicators value changes by year
Meaning:
490.0K
Minimum:
10.0K
jan 1, 2010
Maximum:
2.62 mln
jan 1, 2004
At the date of observation
Value
Absolute change
Change from the previous value
jan 1, 1998
270.0K
+270.0K
0.0%
jan 1, 1999
1.16 mln
+890.0K
329.63%
jan 1, 2000
250.0K
-910.0K
-78.45%
jan 1, 2001
1.27 mln
+1.02 mln
408.0%
jan 1, 2002
390.0K
-880.0K
-69.29%
jan 1, 2003
960.0K
+570.0K
146.15%
jan 1, 2004
2.62 mln
+1.66 mln
172.92%
jan 1, 2005
530.0K
-2.09 mln
-79.77%
jan 1, 2006
220.0K
-310.0K
-58.49%
jan 1, 2007
180.0K
-40.0K
-18.18%
jan 1, 2008
390.0K
+210.0K
116.67%
jan 1, 2010
10.0K
-380.0K
-97.44%
jan 1, 2011
30.0K
+20.0K
200.0%
jan 1, 2012
10.0K
-20.0K
-66.67%
jan 1, 2013
10.0K
0.0
0.0%
jan 1, 2014
10.0K
0.0
0.0%
jan 1, 2015
20.0K
+10.0K
100.0%
Ranking of countries by current statistics by years