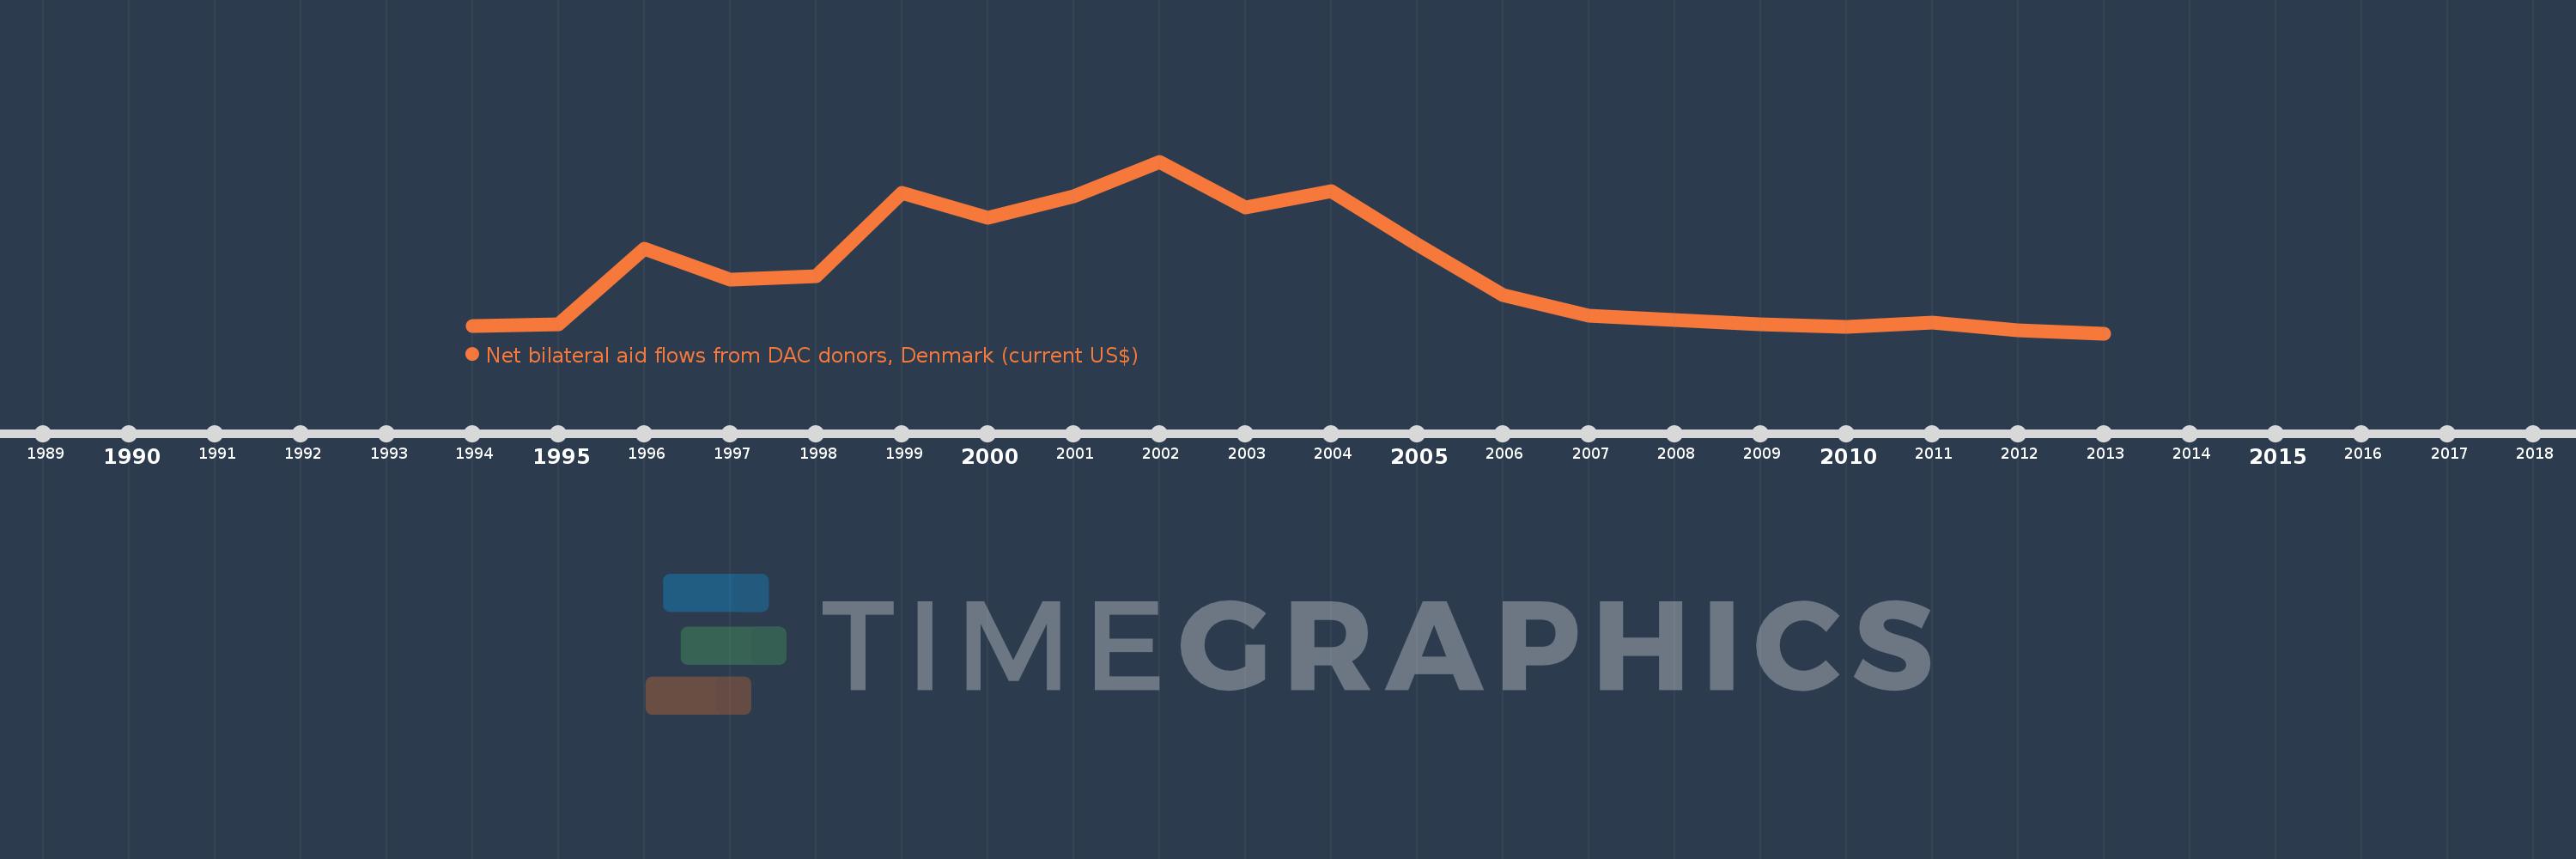
This timeline shows a graph from 1994 to 2013 of Eritrea. No data until 1993. Number of actual observations by date: 20.
Source name:
World Development Indicators
Source organization:
Development Assistance Committee of the Organisation for Economic Co-operation and Development, Geographical Distribution of Financial Flows to Developing Countries, Development Co-operation Report, and International Development Statistics database. Data are available online at: www.oecd.org/dac/stats/idsonline.
Categories, topics:
Aid Effectiveness
Last updated:
apr 23, 2017
Indicators value changes by year
Meaning:
5.0 mln
Minimum:
60.0K
jan 1, 2013
Maximum:
13.85 mln
jan 1, 2002
At the date of observation
Value
Absolute change
Change from the previous value
jan 1, 1994
660.0K
+660.0K
0.0%
jan 1, 1995
770.0K
+110.0K
16.67%
jan 1, 1996
6.88 mln
+6.11 mln
793.51%
jan 1, 1997
4.38 mln
-2.5 mln
-36.34%
jan 1, 1998
4.64 mln
+260.0K
5.94%
jan 1, 1999
11.32 mln
+6.68 mln
143.97%
jan 1, 2000
9.3 mln
-2.02 mln
-17.84%
jan 1, 2001
11.03 mln
+1.73 mln
18.6%
jan 1, 2002
13.85 mln
+2.82 mln
25.57%
jan 1, 2003
10.18 mln
-3.67 mln
-26.5%
jan 1, 2004
11.46 mln
+1.28 mln
12.57%
jan 1, 2005
7.17 mln
-4.29 mln
-37.43%
jan 1, 2006
3.14 mln
-4.03 mln
-56.21%
jan 1, 2007
1.48 mln
-1.66 mln
-52.87%
jan 1, 2008
1.11 mln
-370.0K
-25.0%
jan 1, 2009
780.0K
-330.0K
-29.73%
jan 1, 2010
560.0K
-220.0K
-28.21%
jan 1, 2011
910.0K
+350.0K
62.5%
jan 1, 2012
310.0K
-600.0K
-65.93%
jan 1, 2013
60.0K
-250.0K
-80.65%
Ranking of countries by current statistics by years