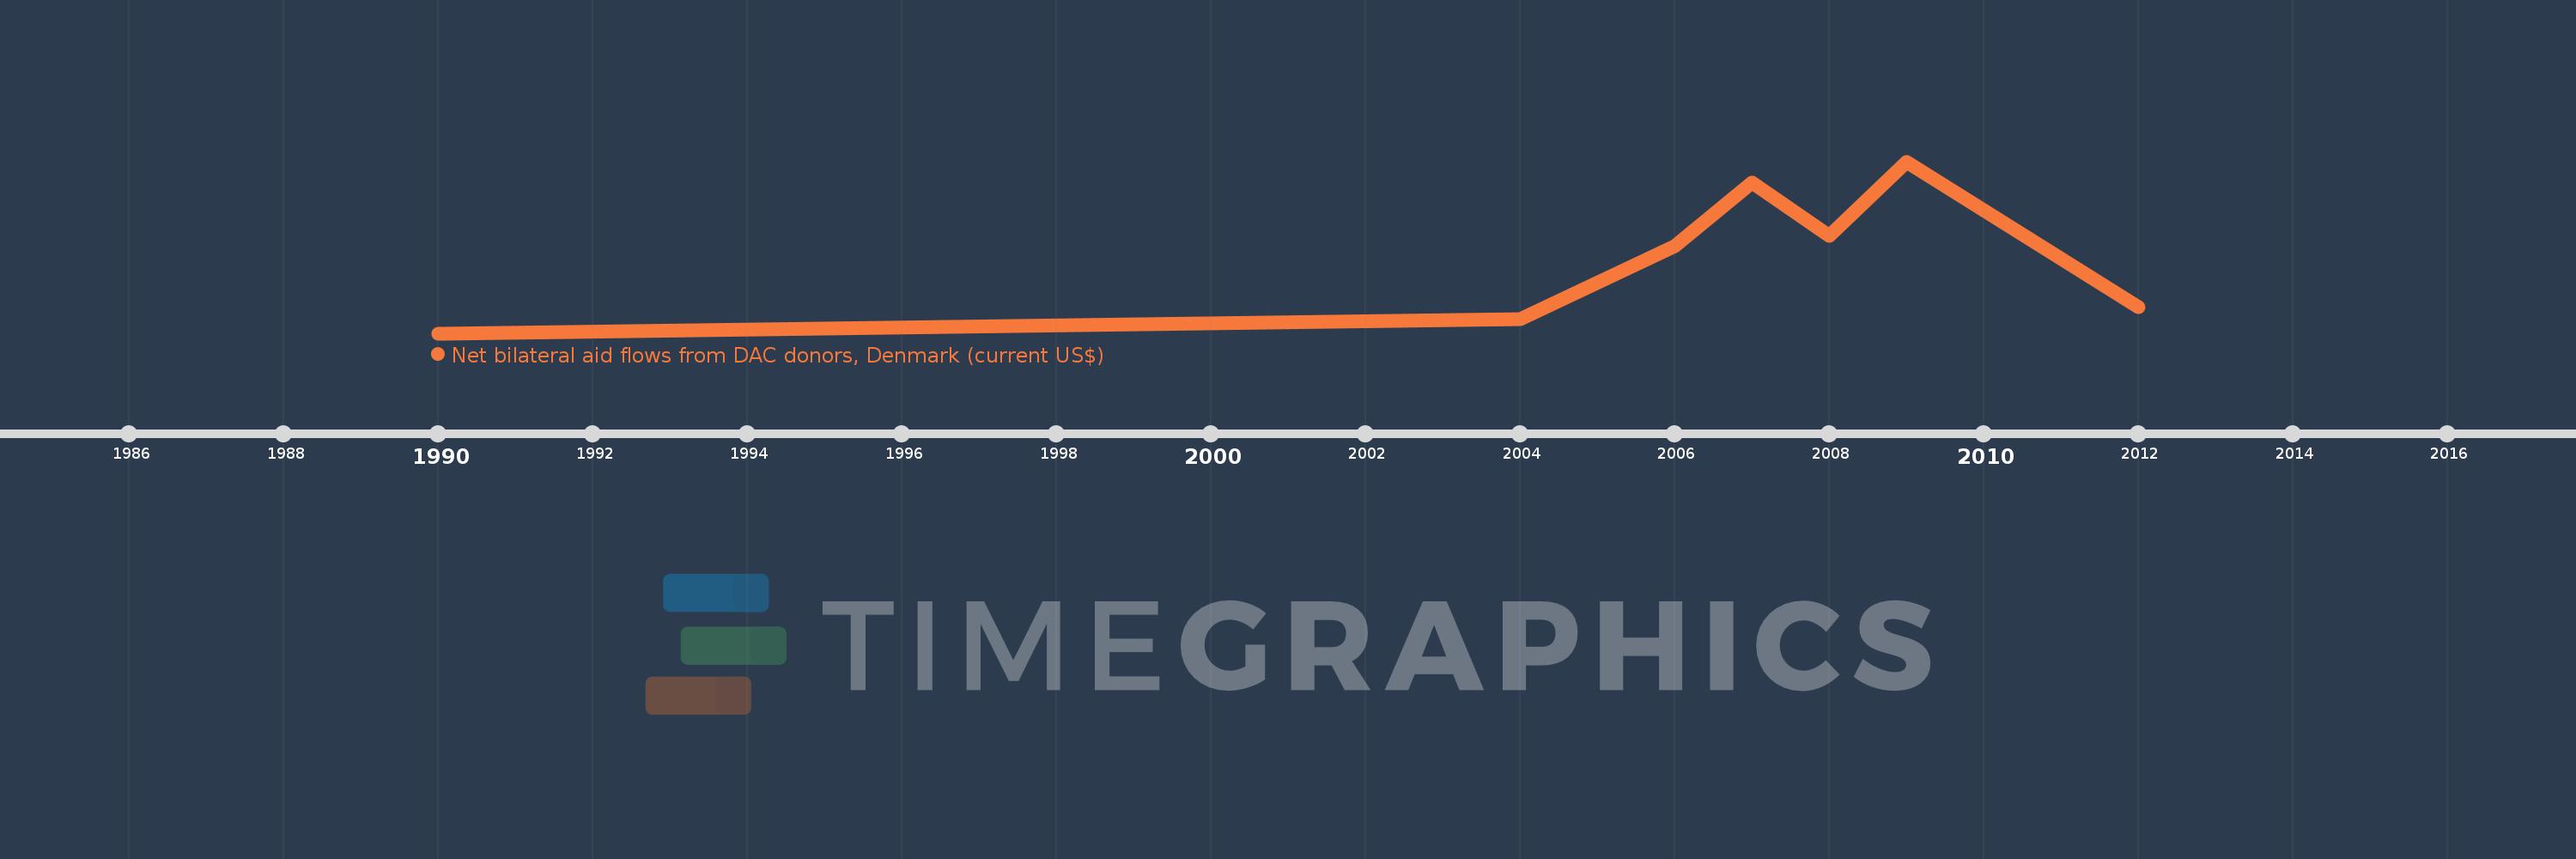
This timeline shows a graph from 1990 to 2012 of Korea, Dem. People’s Rep.. No data until 1989. Number of actual observations by date: 7.
Source name:
World Development Indicators
Source organization:
Development Assistance Committee of the Organisation for Economic Co-operation and Development, Geographical Distribution of Financial Flows to Developing Countries, Development Co-operation Report, and International Development Statistics database. Data are available online at: www.oecd.org/dac/stats/idsonline.
Categories, topics:
Aid Effectiveness
Last updated:
apr 23, 2017
Indicators value changes by year
Meaning:
711.429K
Minimum:
-150.0K
jan 1, 1990
Maximum:
1.74 mln
jan 1, 2009
At the date of observation
Value
Absolute change
Change from the previous value
jan 1, 1990
-150.0K
-150.0K
0.0%
jan 1, 2004
10.0K
+160.0K
-106.67%
jan 1, 2006
810.0K
+800.0K
8.0K%
jan 1, 2007
1.51 mln
+700.0K
86.42%
jan 1, 2008
920.0K
-590.0K
-39.07%
jan 1, 2009
1.74 mln
+820.0K
89.13%
jan 1, 2012
140.0K
-1.6 mln
-91.95%
Ranking of countries by current statistics by years