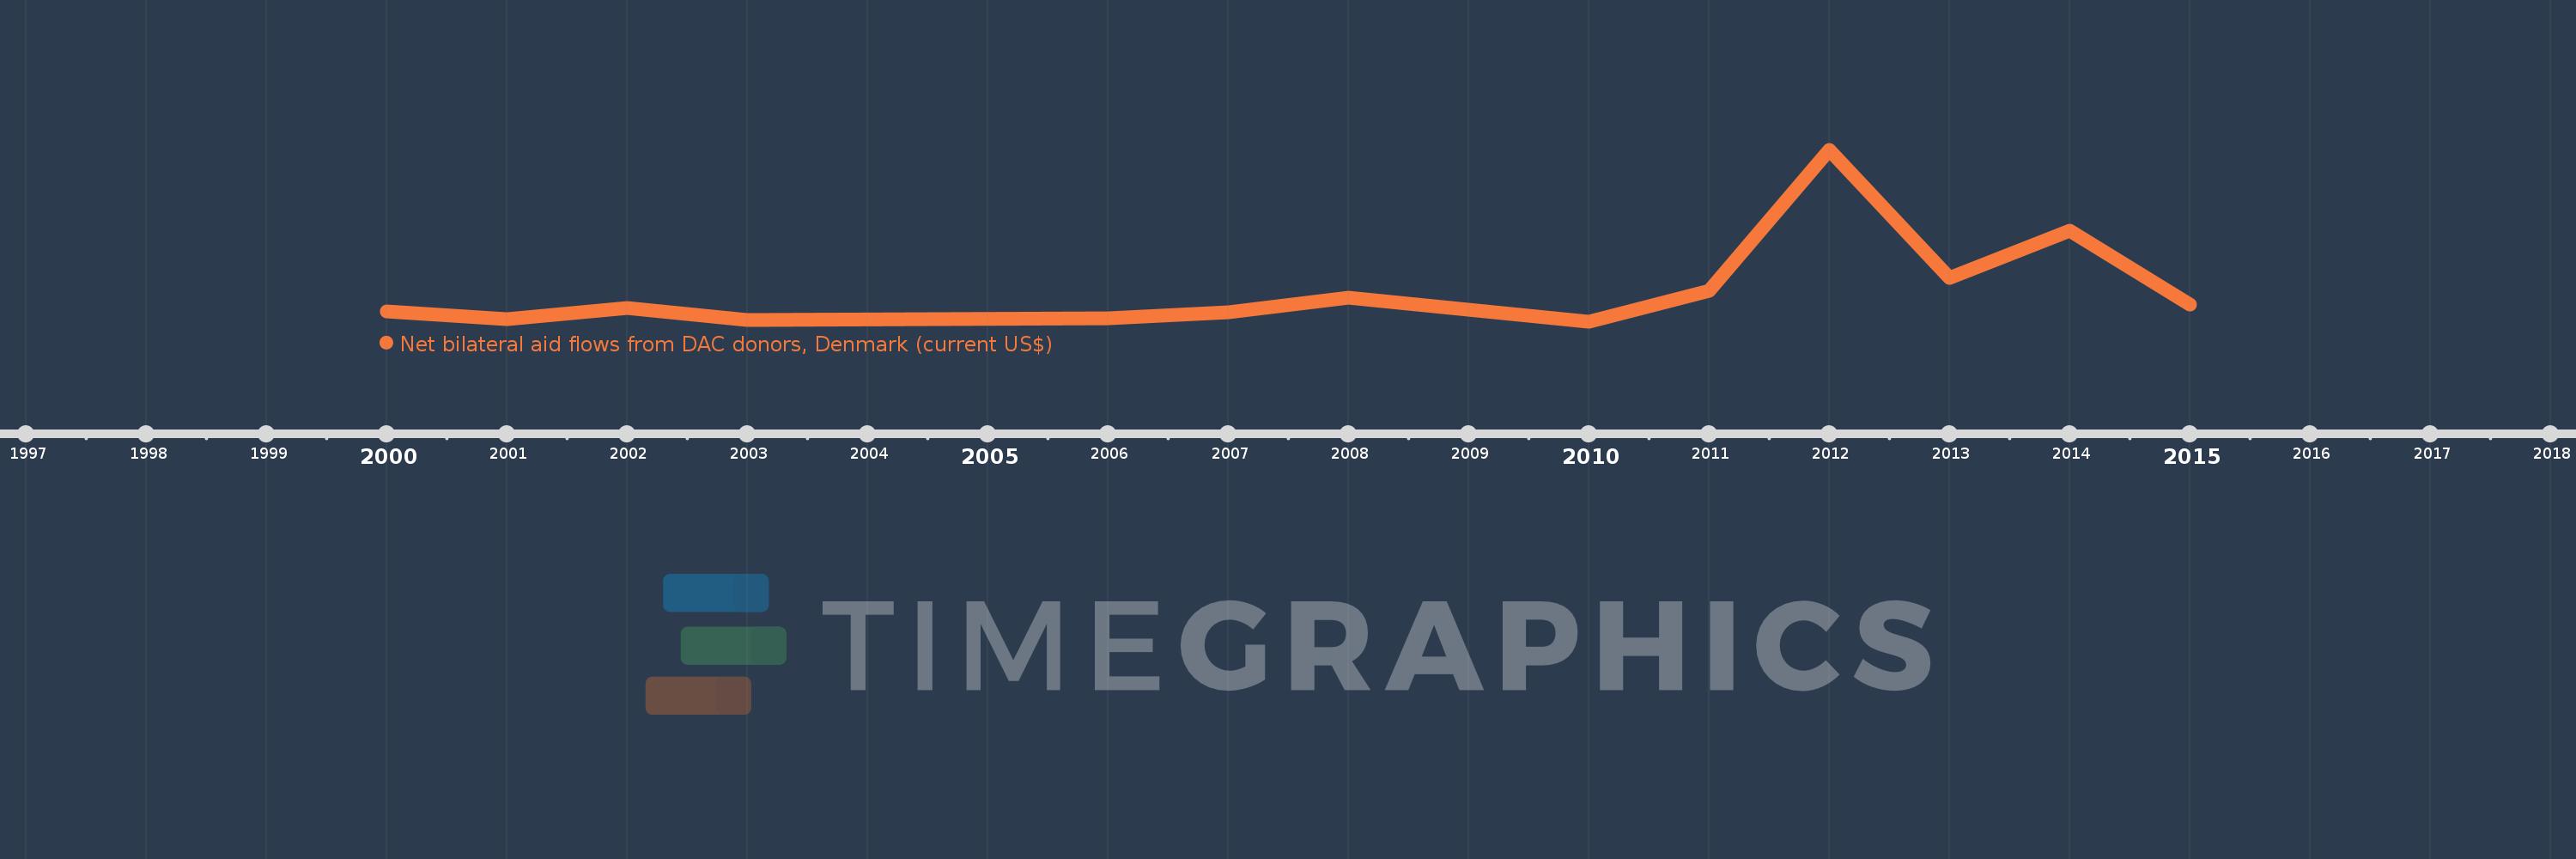
This timeline shows a graph from 2000 to 2015 of Tajikistan. No data until 1999. Number of actual observations by date: 13.
Source name:
World Development Indicators
Source organization:
Development Assistance Committee of the Organisation for Economic Co-operation and Development, Geographical Distribution of Financial Flows to Developing Countries, Development Co-operation Report, and International Development Statistics database. Data are available online at: www.oecd.org/dac/stats/idsonline.
Categories, topics:
Aid Effectiveness
Last updated:
apr 23, 2017
Indicators value changes by year
Meaning:
509.231K
Minimum:
30.0K
jan 1, 2010
Maximum:
2.56 mln
jan 1, 2012
At the date of observation
Value
Absolute change
Change from the previous value
jan 1, 2000
180.0K
+180.0K
0.0%
jan 1, 2001
70.0K
-110.0K
-61.11%
jan 1, 2002
230.0K
+160.0K
228.57%
jan 1, 2003
60.0K
-170.0K
-73.91%
jan 1, 2006
90.0K
+30.0K
50.0%
jan 1, 2007
170.0K
+80.0K
88.89%
jan 1, 2008
390.0K
+220.0K
129.41%
jan 1, 2010
30.0K
-360.0K
-92.31%
jan 1, 2011
490.0K
+460.0K
1.53K%
jan 1, 2012
2.56 mln
+2.07 mln
422.45%
jan 1, 2013
680.0K
-1.88 mln
-73.44%
jan 1, 2014
1.38 mln
+700.0K
102.94%
jan 1, 2015
290.0K
-1.09 mln
-78.99%
Ranking of countries by current statistics by years