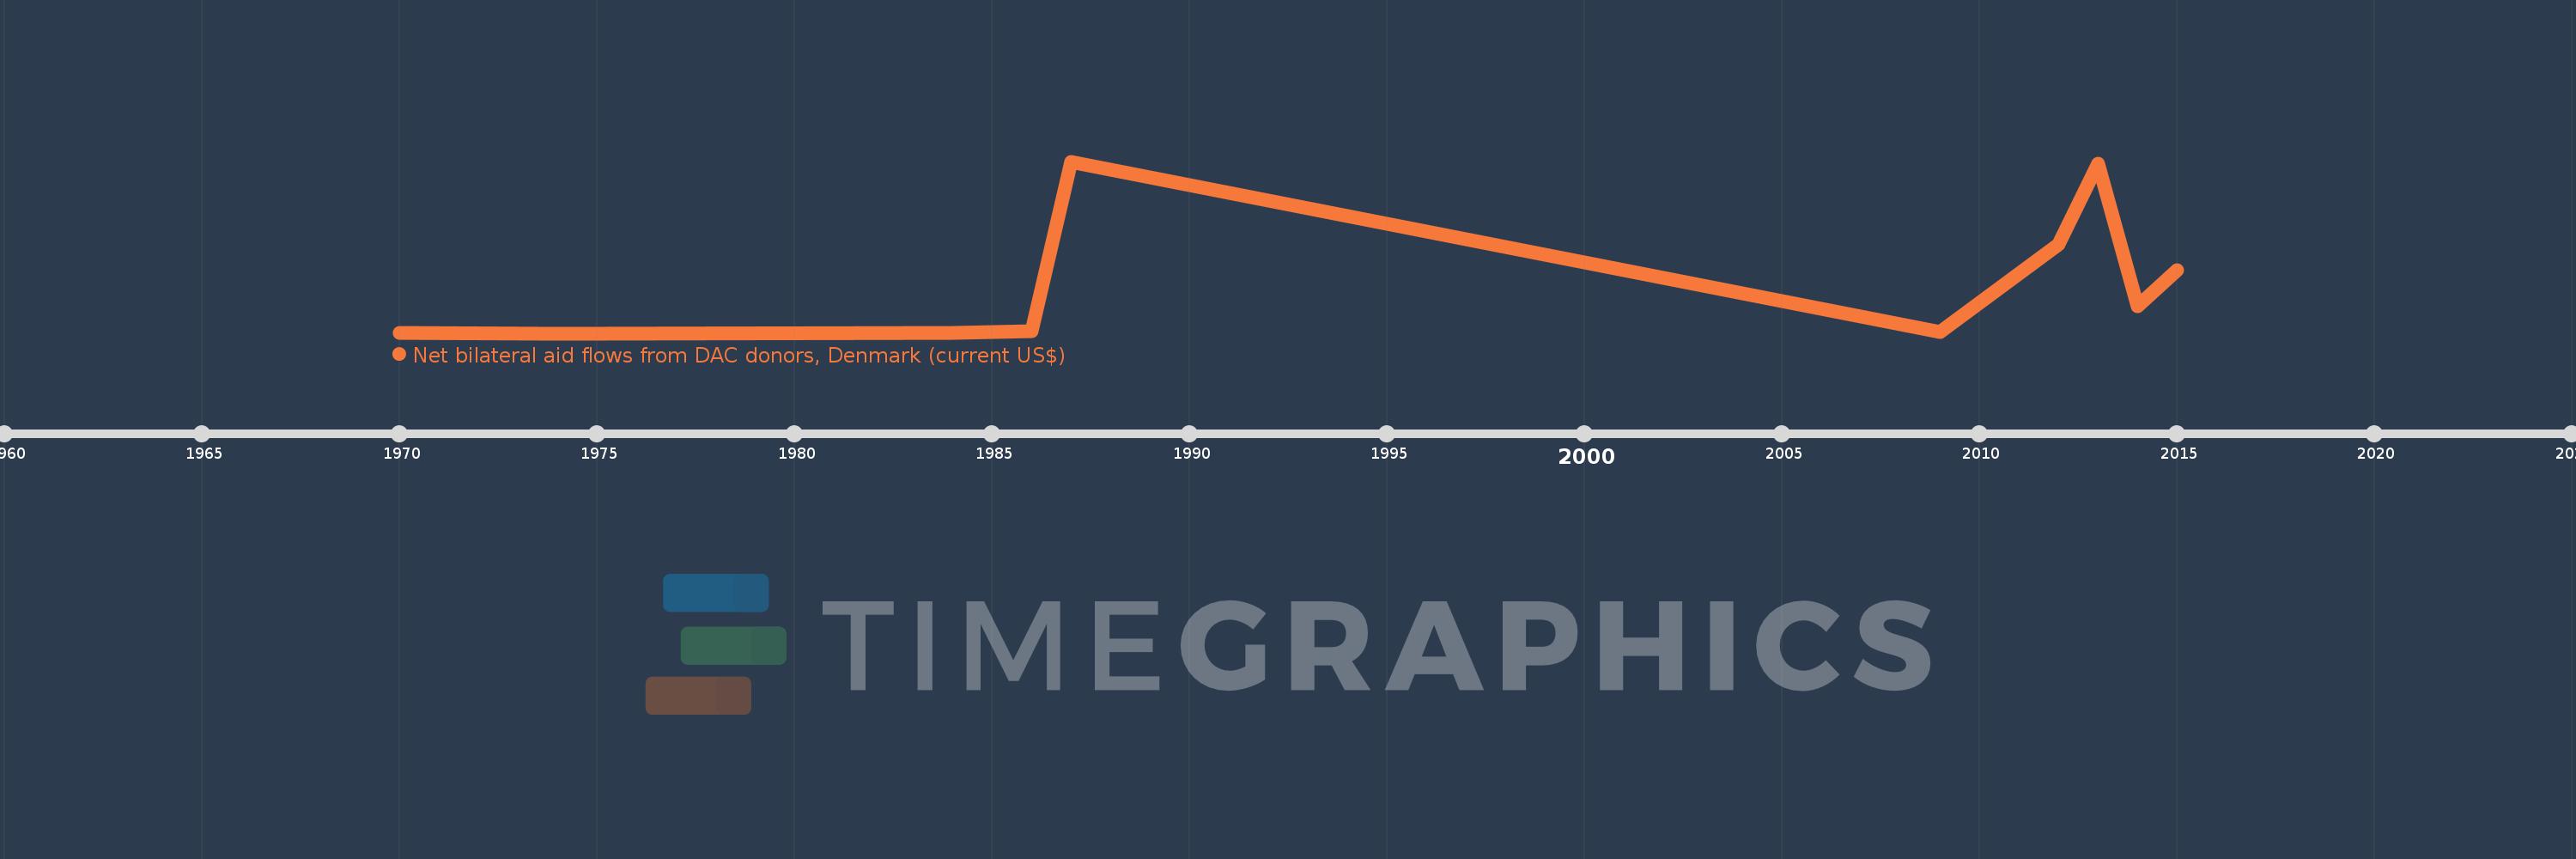
This timeline shows a graph from 1970 to 2015 of Libya. No data until 1969. Number of actual observations by date: 10.
Source name:
World Development Indicators
Source organization:
Development Assistance Committee of the Organisation for Economic Co-operation and Development, Geographical Distribution of Financial Flows to Developing Countries, Development Co-operation Report, and International Development Statistics database. Data are available online at: www.oecd.org/dac/stats/idsonline.
Categories, topics:
Aid Effectiveness
Last updated:
apr 23, 2017
Indicators value changes by year
Meaning:
1.77 mln
Minimum:
10.0K
jan 1, 1974
Maximum:
5.76 mln
jan 1, 1987
At the date of observation
Value
Absolute change
Change from the previous value
jan 1, 1970
30.0K
+30.0K
0.0%
jan 1, 1974
10.0K
-20.0K
-66.67%
jan 1, 1984
20.0K
+10.0K
100.0%
jan 1, 1986
70.0K
+50.0K
250.0%
jan 1, 1987
5.76 mln
+5.69 mln
8.13K%
jan 1, 2009
50.0K
-5.71 mln
-99.13%
jan 1, 2012
3.0 mln
+2.95 mln
5.9K%
jan 1, 2013
5.7 mln
+2.7 mln
90.0%
jan 1, 2014
930.0K
-4.77 mln
-83.68%
jan 1, 2015
2.13 mln
+1.2 mln
129.03%
Ranking of countries by current statistics by years