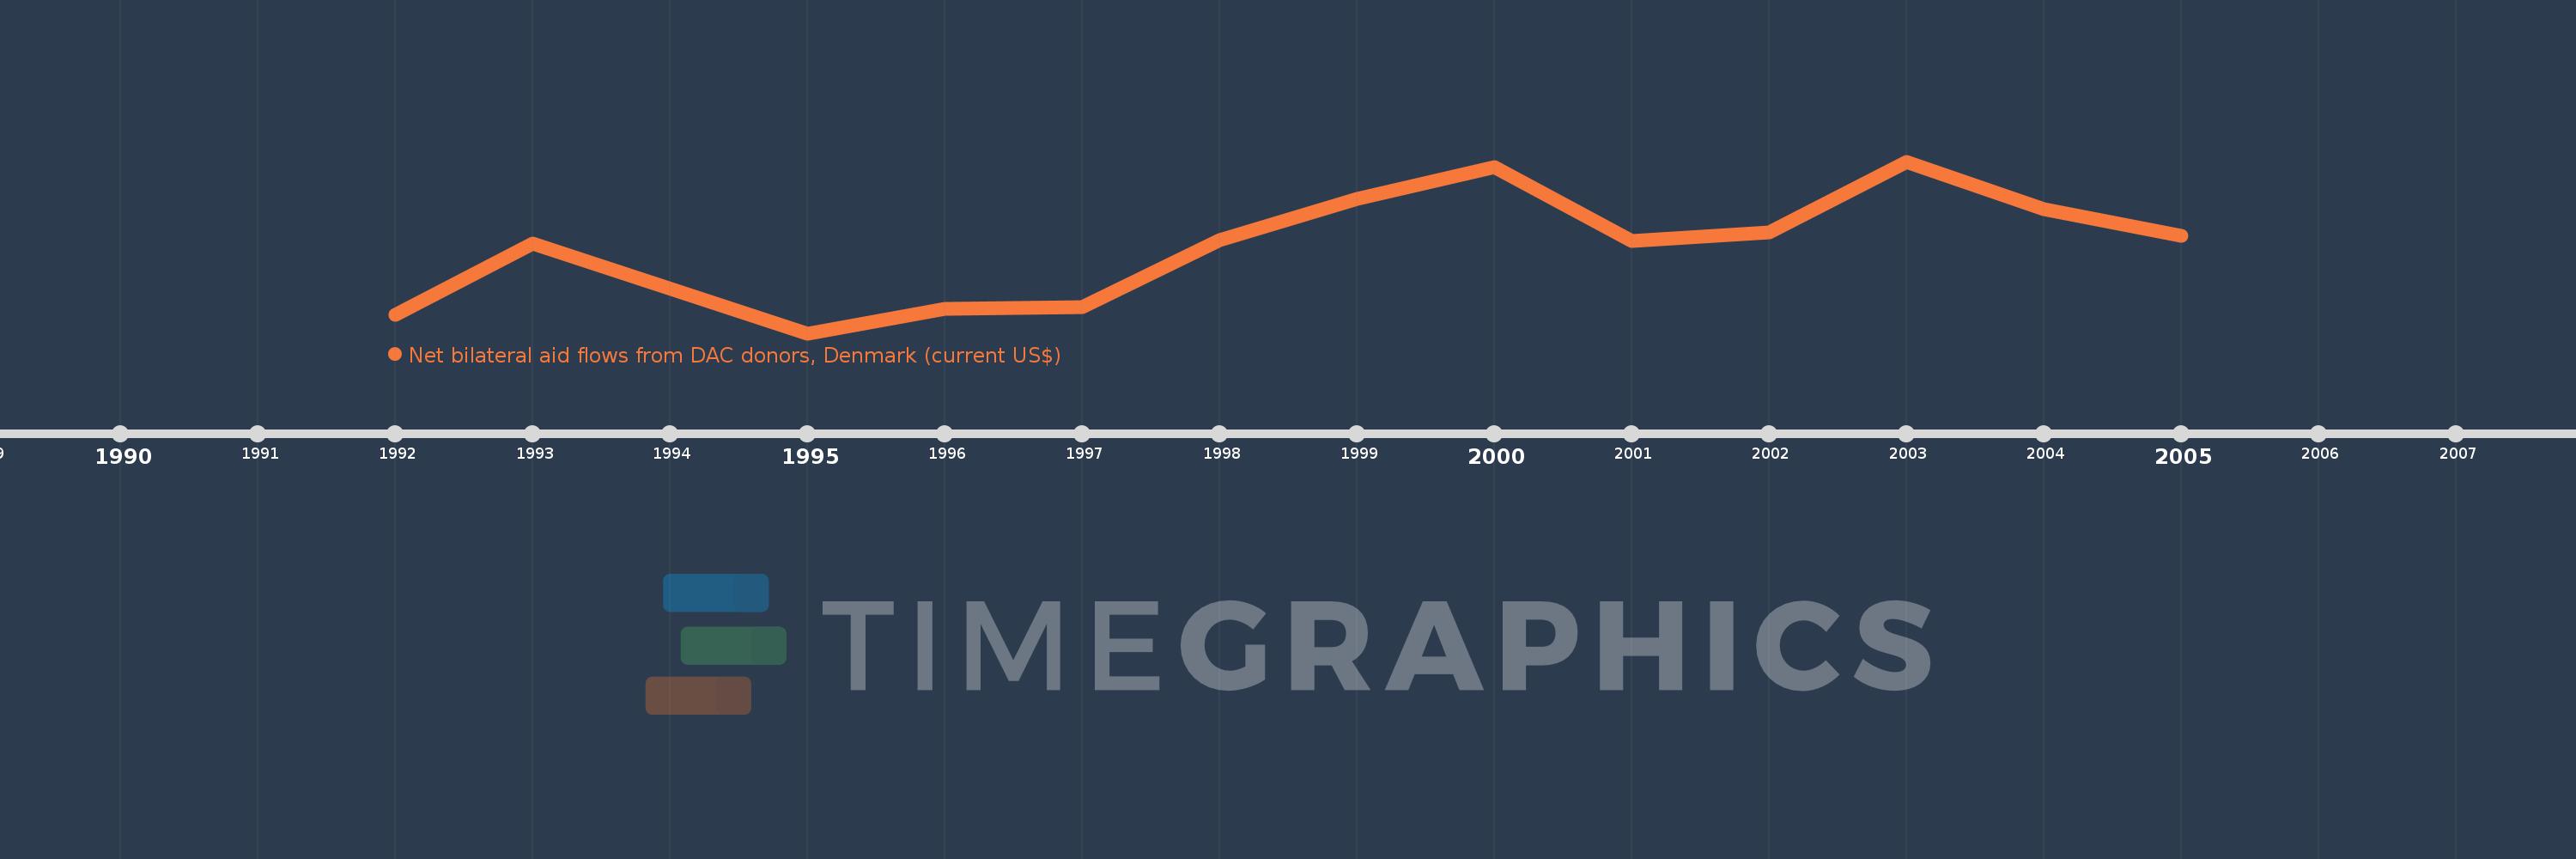
This timeline shows a graph from 1992 to 2005 of Estonia. No data until 1991. Number of actual observations by date: 13.
Source name:
World Development Indicators
Source organization:
Development Assistance Committee of the Organisation for Economic Co-operation and Development, Geographical Distribution of Financial Flows to Developing Countries, Development Co-operation Report, and International Development Statistics database. Data are available online at: www.oecd.org/dac/stats/idsonline.
Categories, topics:
Aid Effectiveness
Last updated:
apr 23, 2017
Indicators value changes by year
Meaning:
6.439 mln
Minimum:
490.0K
jan 1, 1995
Maximum:
12.16 mln
jan 1, 2003
At the date of observation
Value
Absolute change
Change from the previous value
jan 1, 1992
1.73 mln
+1.73 mln
0.0%
jan 1, 1993
6.6 mln
+4.87 mln
281.5%
jan 1, 1995
490.0K
-6.11 mln
-92.58%
jan 1, 1996
2.13 mln
+1.64 mln
334.69%
jan 1, 1997
2.28 mln
+150.0K
7.04%
jan 1, 1998
6.83 mln
+4.55 mln
199.56%
jan 1, 1999
9.61 mln
+2.78 mln
40.7%
jan 1, 2000
11.78 mln
+2.17 mln
22.58%
jan 1, 2001
6.78 mln
-5.0 mln
-42.44%
jan 1, 2002
7.32 mln
+540.0K
7.96%
jan 1, 2003
12.16 mln
+4.84 mln
66.12%
jan 1, 2004
8.9 mln
-3.26 mln
-26.81%
jan 1, 2005
7.1 mln
-1.8 mln
-20.22%
Ranking of countries by current statistics by years