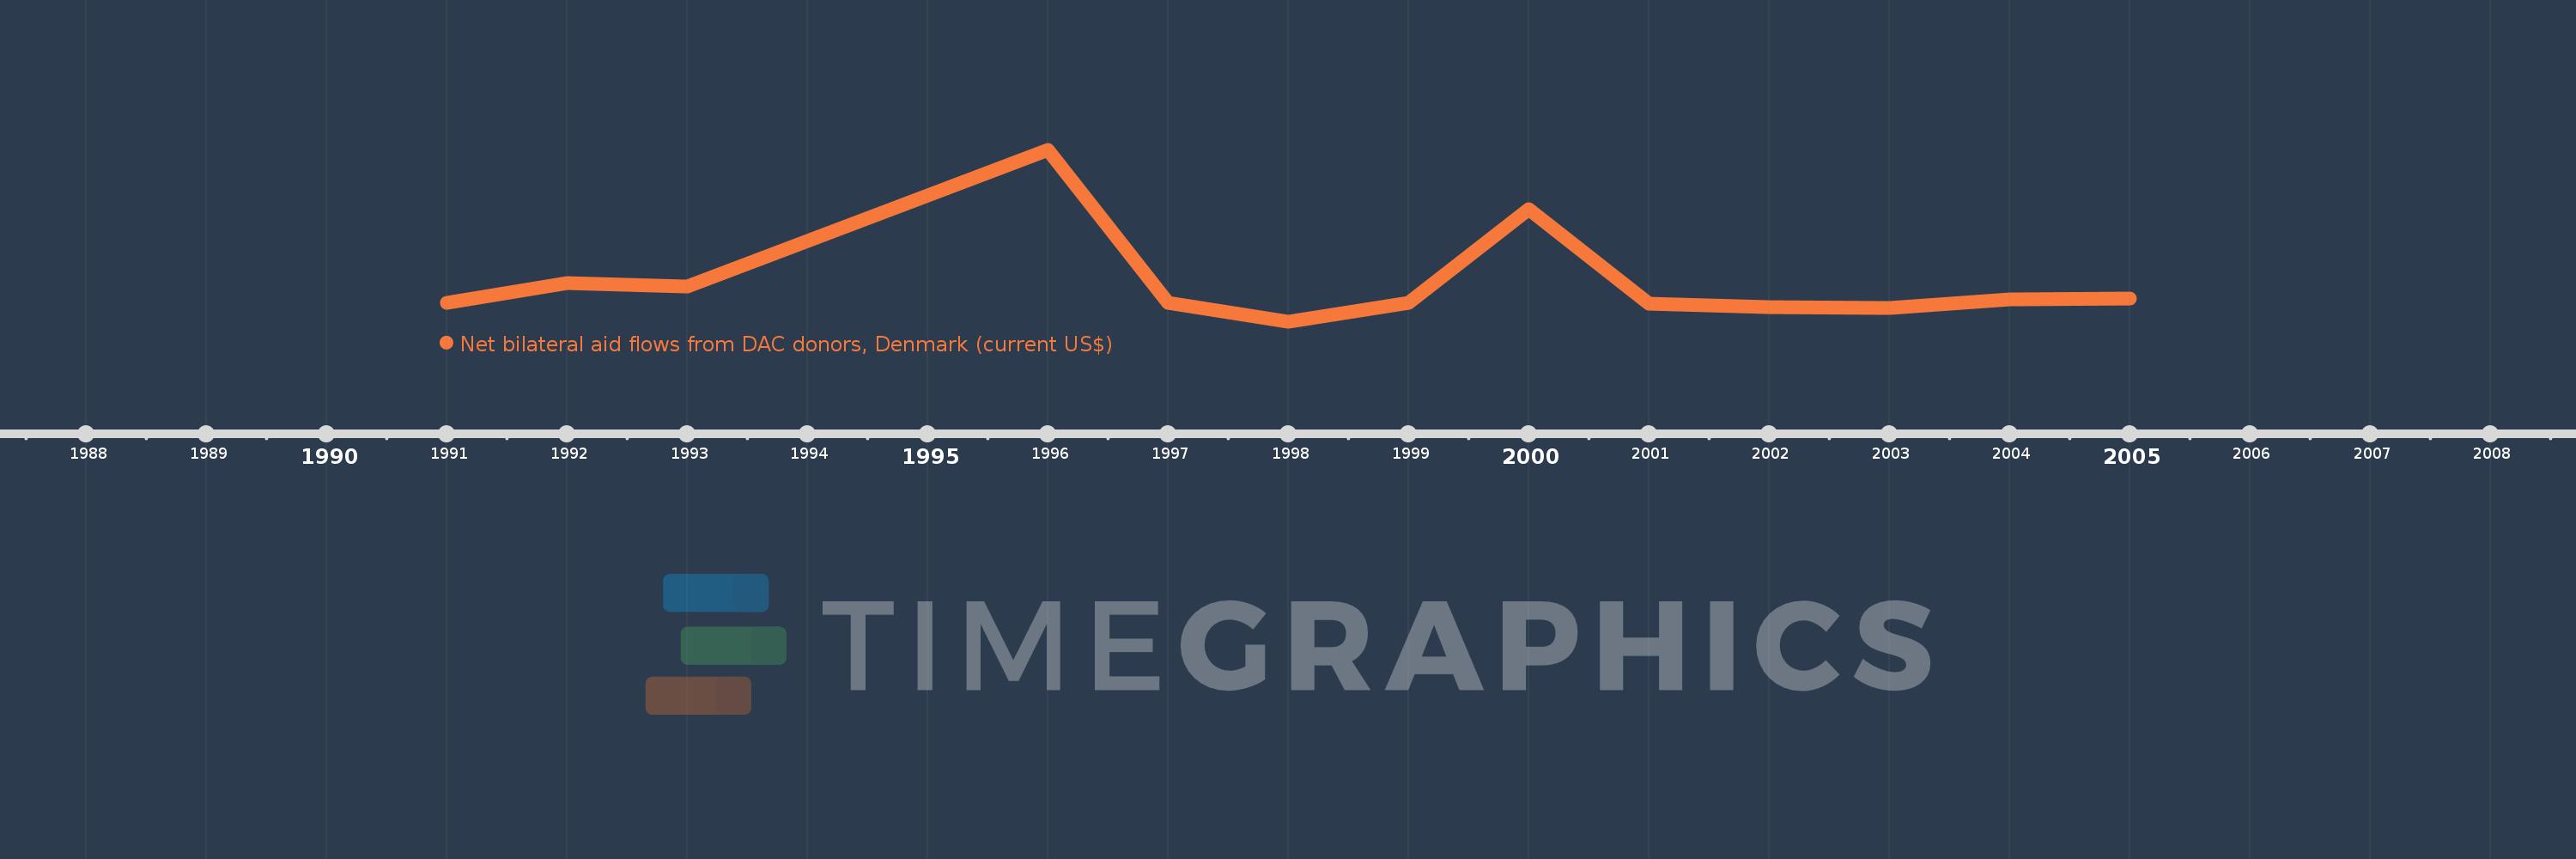
This timeline shows a graph from 1991 to 2005 of Hungary. No data until 1990. Number of actual observations by date: 13.
Source name:
World Development Indicators
Source organization:
Development Assistance Committee of the Organisation for Economic Co-operation and Development, Geographical Distribution of Financial Flows to Developing Countries, Development Co-operation Report, and International Development Statistics database. Data are available online at: www.oecd.org/dac/stats/idsonline.
Categories, topics:
Aid Effectiveness
Last updated:
apr 23, 2017
Indicators value changes by year
Meaning:
2.649 mln
Minimum:
-1.03 mln
jan 1, 1998
Maximum:
15.07 mln
jan 1, 1996
At the date of observation
Value
Absolute change
Change from the previous value
jan 1, 1991
790.0K
+790.0K
0.0%
jan 1, 1992
2.61 mln
+1.82 mln
230.38%
jan 1, 1993
2.31 mln
-300.0K
-11.49%
jan 1, 1996
15.07 mln
+12.76 mln
552.38%
jan 1, 1997
770.0K
-14.3 mln
-94.89%
jan 1, 1998
-1.03 mln
-1.8 mln
-233.77%
jan 1, 1999
800.0K
+1.83 mln
-177.67%
jan 1, 2000
9.53 mln
+8.73 mln
1.09K%
jan 1, 2001
650.0K
-8.88 mln
-93.18%
jan 1, 2002
360.0K
-290.0K
-44.62%
jan 1, 2003
320.0K
-40.0K
-11.11%
jan 1, 2004
1.12 mln
+800.0K
250.0%
jan 1, 2005
1.14 mln
+20.0K
1.79%
Ranking of countries by current statistics by years